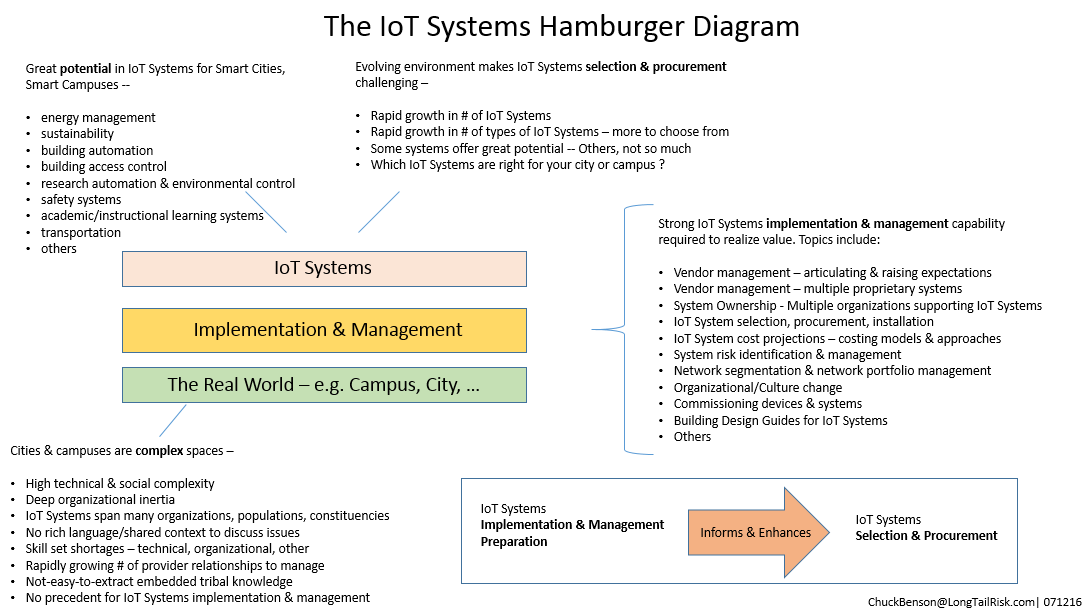
Jan Cheetham and I speak on IoT Systems risk mitigation at the University of Wisconsin-Madison Lockdown Cybersecurity Conference in July.
Tag Archives: risk
Hearing transcript: China, the United States, and Next Generation Connectivity
The transcript of the hearing on “China, the United States, and Next Generation Connectivity” before the US-China Economic and Security Review Commission, addressing IoT and 5G technologies, came out this week and is available here. My testimony is early in the document. See earlier post for overview.
Testimony before US-China Economic & Security Review Commission re IoT & 5G
Earlier this month, at the invitation of the US-China Economic and Security Review Commission, I submitted written testimony and subsequently testified at the China, the United States, and Next Generation Connectivity hearing regarding IoT Systems risk mitigation for institutions and cities as well as considerations regarding 5G deployments on the same.
A copy of the written testimony is here. A transcript of the oral testimony will be available in the next weeks.
The testimony discussed potential benefits of IoT Systems for US government, cities, universities, other institutions, and companies. It also discussed risks to those same entities from IoT Systems implementations. The risks discussed include:
- Supply chain risks
- Poor selection, procurement, implementation, and management of IoT Systems
- Lack of institutional governance and lack of awareness of social-technical issues in IoT Systems deployments
Prior to the testimony, I was asked how the US government could help. I suggested these four areas in the testimony:
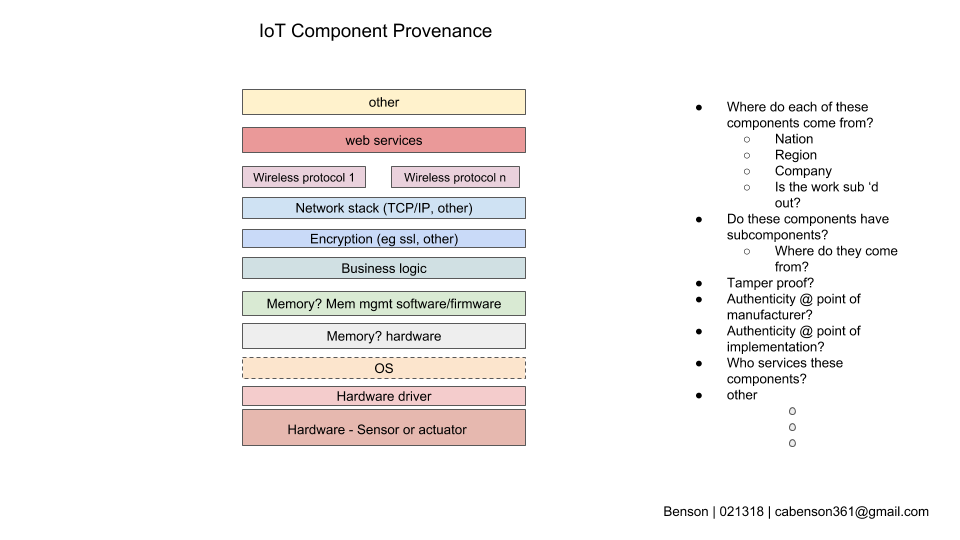
- Standardized provenance vetting and reporting for IoT device components
- Support for increased US labor force training in Operational Technology (OT) skill sets
- Support for development of institutional and city IoT governance frameworks
- Support for data ethnography and socio-technical research and application in context of IoT Systems
The testimony also included comments on supply chain risks:
As well as aspects previously discussed in this blog such as the ability of an institution or city to manage their IoT systems:
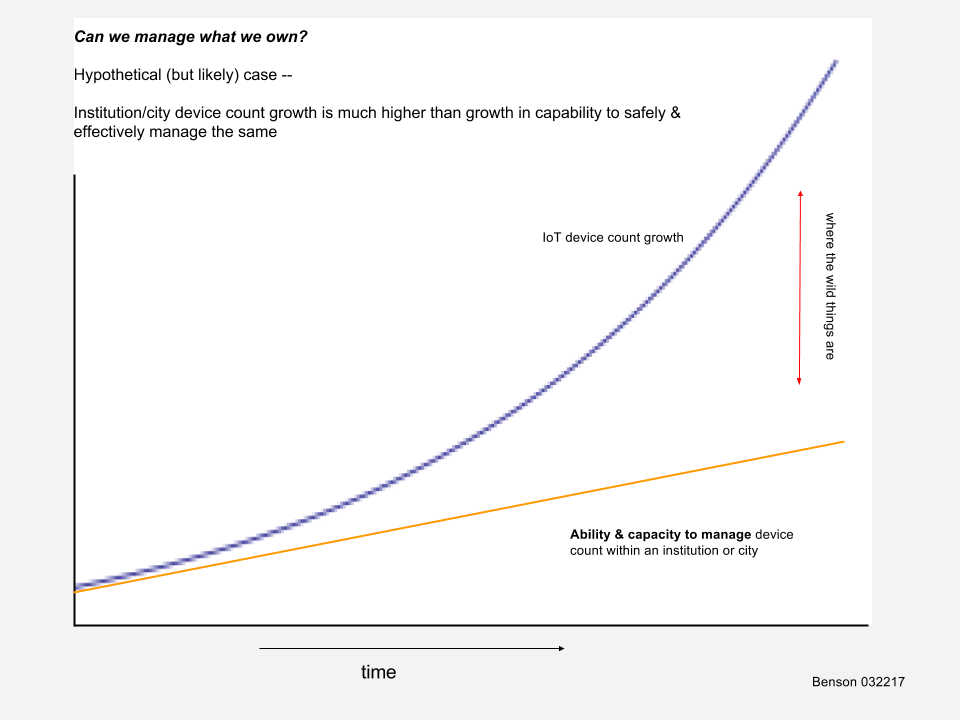
where the wild things are [reference to Sendak]
https://www.uscc.gov/sites/default/files/Chuck%20Benson_Written%20Testimony.pdf
Bathtubs, manageability, & IoT
The limited funding and staffing resources inherent in almost all institutions and cities creates a delicate balance between IT systems operations, managing institutional risk, and cybersecurity operations. A critical component to this balance is systems manageability. Implementing unmanaged/under-managed systems can quickly perturb this balance and cause reactionary spending, such as on cybersecurity incident response, institutional reputation damage control, unplanned systems repair dollars, as well as others.
IoT Systems — with their multi-organizational boundary spanning, unclear systems ownership and accountability, lack of precedence for implementation, and high number of networked computing devices (‘Things’) — are particular candidates for unmanaged/under-managed systems in a city or institution.
Systems manageability
IT systems that tend to be more manageable allow for more predictability in an institution’s resource and cashflow planning. Criteria for high systems manageability include:
- having well-defined performance expectations
- thoughtful and thorough implementation
- accessible training and documentation
- strong vendor support
- others
Unmanaged or under-managed systems increase the likelihood of a cyber event such as device compromise or whole system compromise as well as facilitate potentially substantial operations disruption and unplanned financial burden.
Bathtub modeling
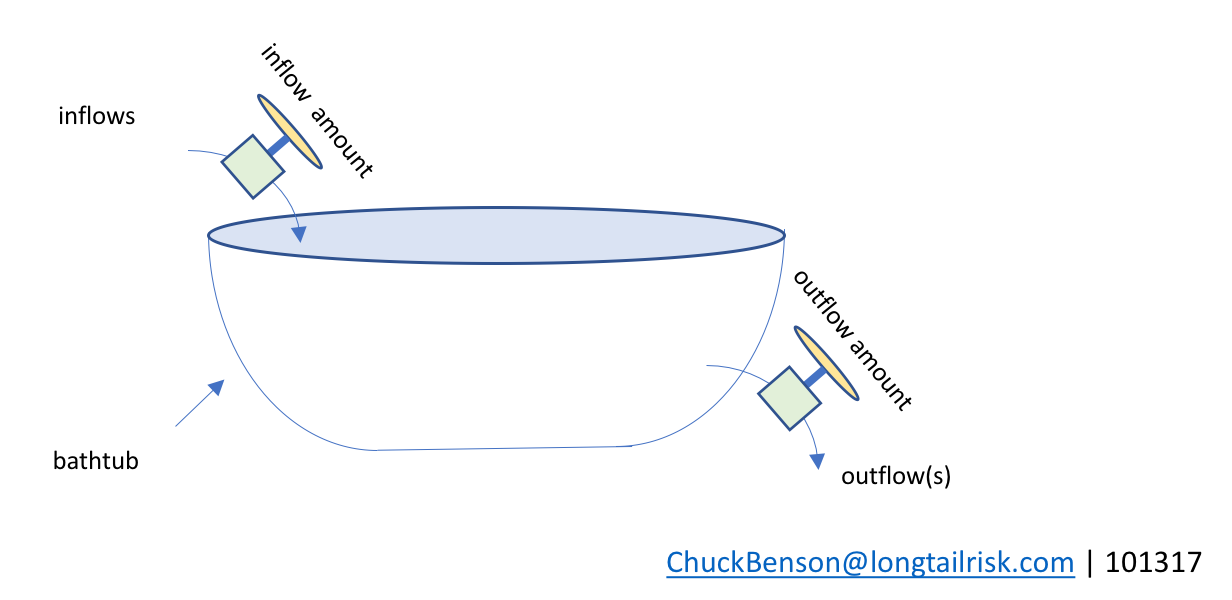
We can use some concepts from stocks and flows diagrams where the stock is represented by a bathtub to create a basic model of resource availability in this delicate dance of balancing of resources for IT systems operations, cybersecurity operations, and managing institutional risk.
My understanding that the use of a bathtub to represent stocks and flows goes back to 2000 when John Sterman and Linda Booth Sweeney published results of an experiment on how people understand and interpret complex systems. On a related note, I found the book, Thinking in Systems, by the late Donella Meadows to be a very consumable and helpful introduction to stocks and flows diagrams.
The idea is that the ‘stock’ is the level of water in the tub. Water can flow into the tub, raising the tub level, and that amount can be varied by some mechanism(s) or external constraints. Similarly, water can flow out of the bathtub, draining the tub, and there is a mechanism for controlling the rate of that outflow. And, of course, both could happen at the same time.
Bathtub of bucks
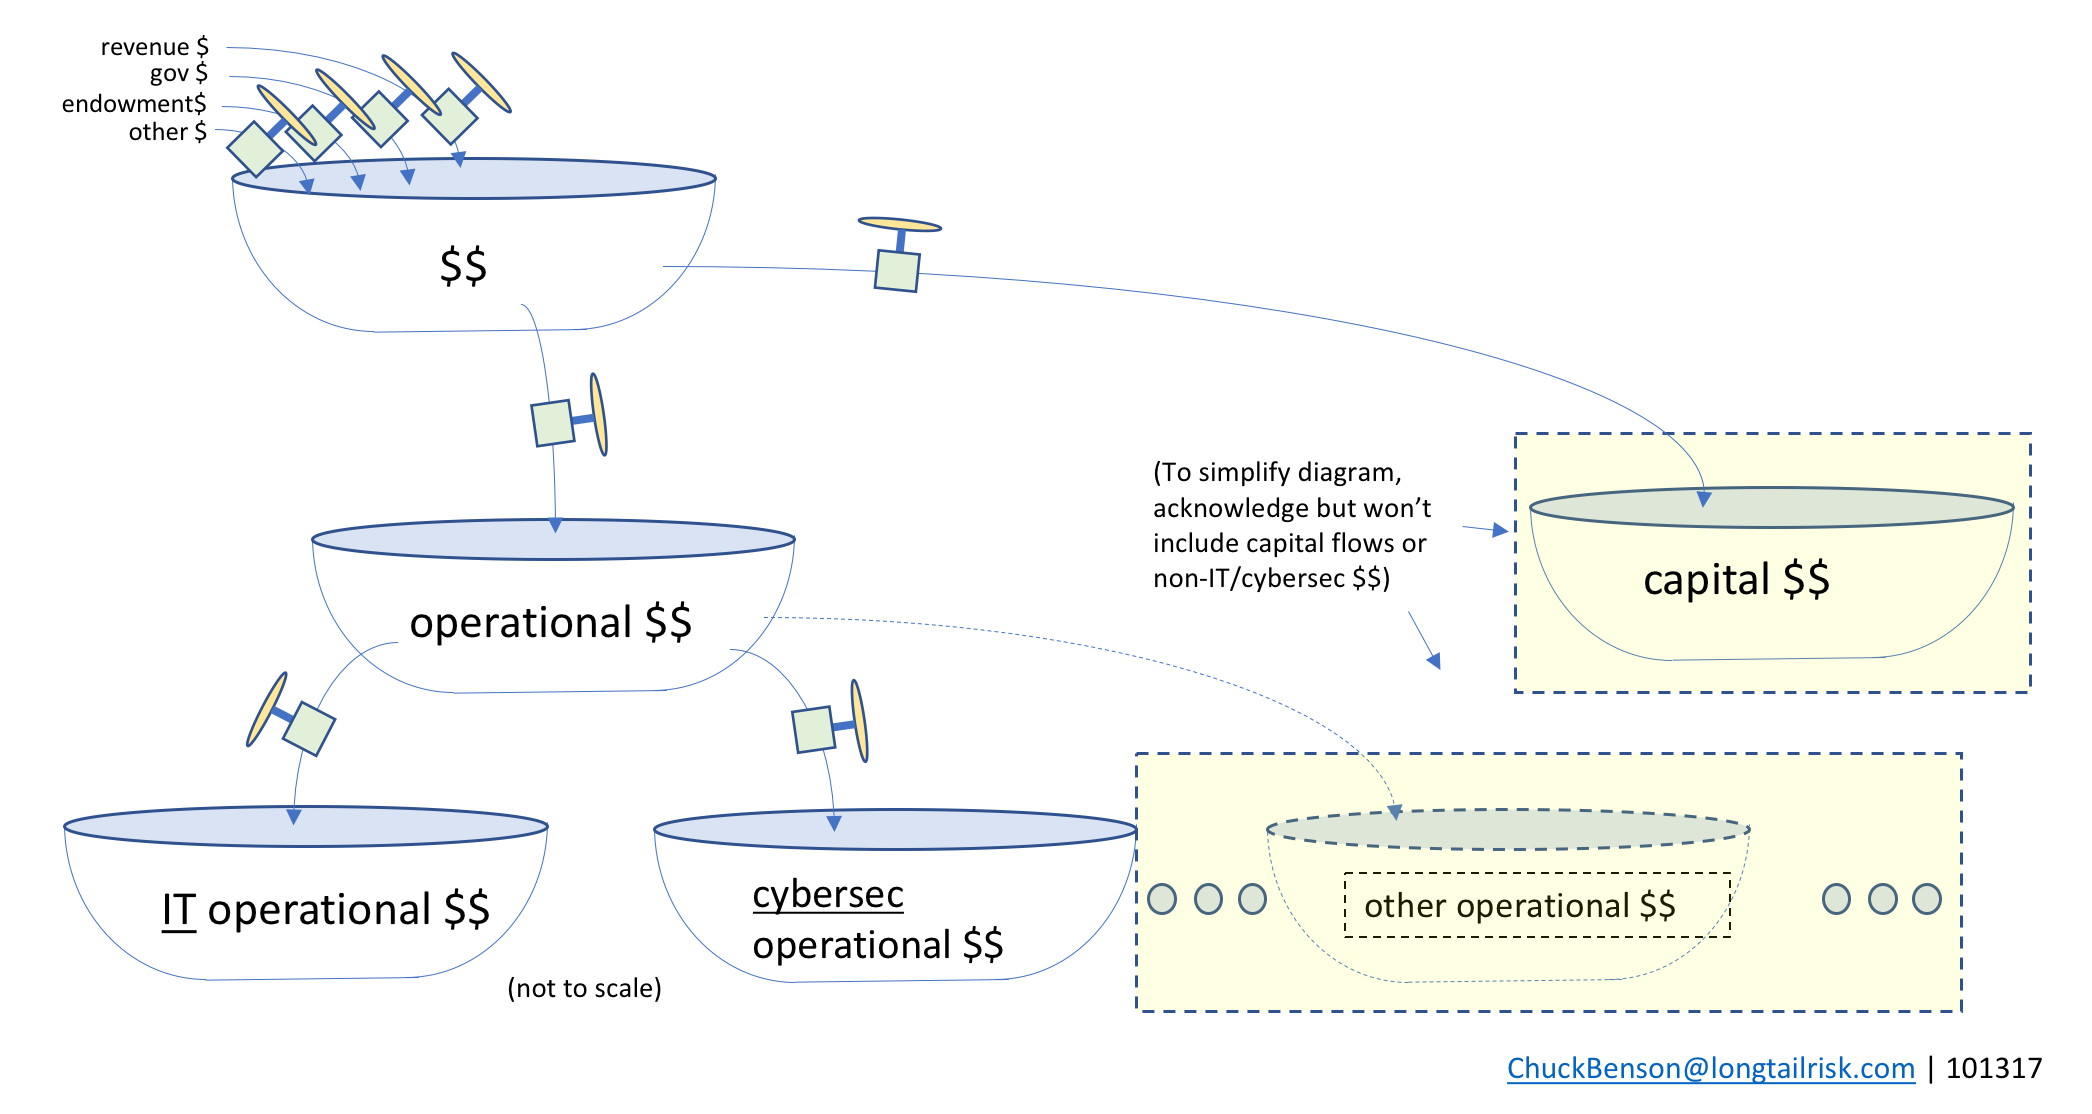
Now, imagine that instead of water, the tub holds metaphorical dollars. The tub can be thought of as an account, a set of funds, ‘budget number’, set of budget numbers, or similar. The inflows then are one or more sources for adding dollars to that tub with a mechanism or set of constraints that determines the rate of flow into the tub. Similarly, there is a mechanism for setting how much flows out of the tub (spending or investing).
City and institutional spending
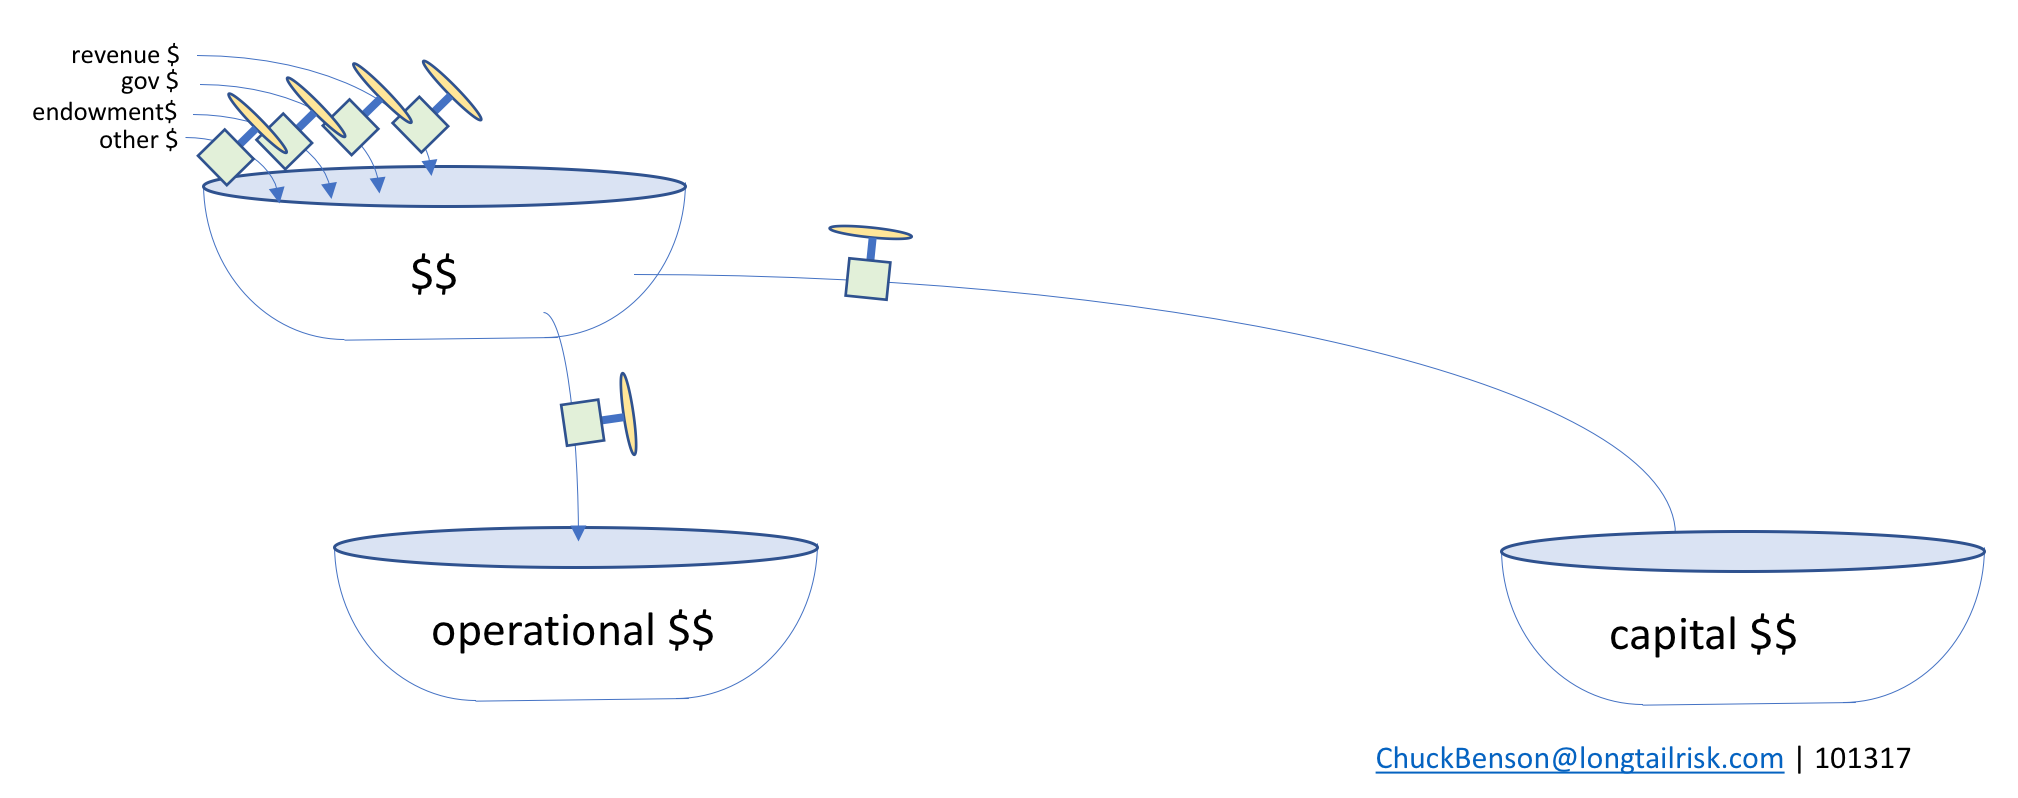
Cities and institutions have multiple sources of inflows, most of which they probably don’t control. Those inflows have independent characteristics from each other as well as some interdependencies with each other. The main takeaway is that the city or institution probably does not control a whole lot regarding what’s coming in.
The spending from the top tub can go to multiple places, themselves other tubs. From the top bathtub, most organizations make decisions between operational dollars (running things) and capital dollars (buying or building big things).
IT & cybersec resources & spending
From the operational dollars tub, some funding goes to IT operations, some goes to cybersecurity operations (eg CISO’s office), and other funding goes to many other traditional and important areas such as HR, finance, policy/law enforcement, and others.
In the interest of keeping the diagram simpler for our discussion, we won’t include capital spending or non-IT/cybersec spending in subsequent diagrams.
IT systems services and cybersecurity services
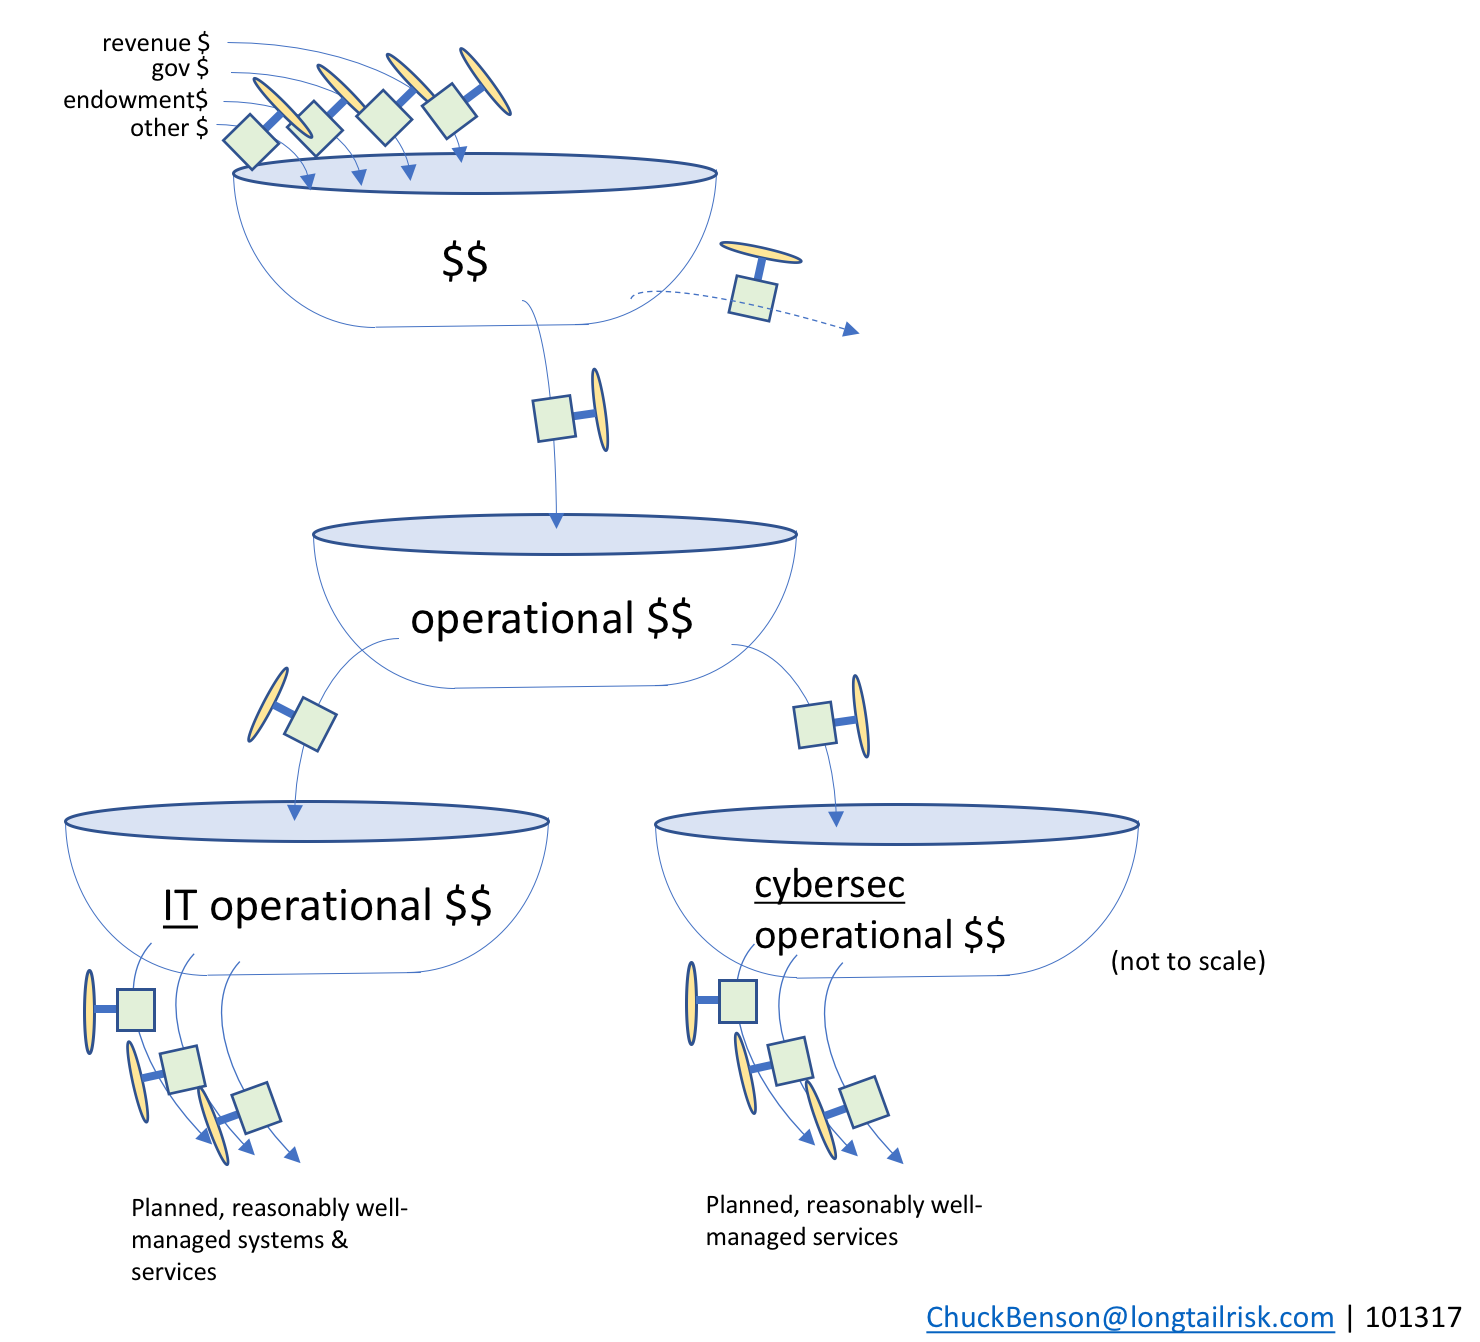
Funds from the IT operational bathtub are used to resource the management of various IT systems and sub-systems in the institution or city. This includes both on-premise systems as well as cloud-based systems. Examples include enterprise resource management (ERP) systems, institutional learning/training systems, calendaring and email systems, and others.
Systems that have known performance expectations and implementation precedents (either themselves or peer implementations) can provide the basis for a fairly reasonable calculation to be made on required staffing and funding support requirements.
Similarly, the city/institutional department/organization providing information security services (usually the CISO’s office) also has a set of well-managed services that are planned for and delivered. Examples of these information security services might include: education and outreach, incident management capability, privacy policy guidance, intelligence analysis, and others. The CISO’s office will work to develop services and capabilities based on the IT systems that the city or institution is operating, known and evolving threats and vulnerabilities, existing risk levels, and others.
The trouble with unplanned, under-managed, and unmanaged systems
Managing and identifying management support resources can be challenging enough with known systems. Challenges and institutional risk quickly becomes exacerbated though when unplanned or weakly planned systems are added. For example, after the budget/planning cycle, an influential person or group may decide that the city or institution “must have” System X. And then later someone else with influence might insist on (unplanned) System Y.
When these unplanned or under-planned systems are added, several deleterious things can happen:
- the unplanned system drains from the IT operational funding tub in the forms of implementation staffing, management staffing, and support tools
- planned systems now no longer have their expected resources and they themselves can become under-managed in addition to the add-on system that is very likely also to be under-managed
- institutional/city risk increases because unmanaged/under-managed systems increase likelihood of system comprise due to misconfiguration, mismanagement, lack of oversight, failure of (or lack of application of) controls
- things get worse as the problem also transmits to a different bathtub, ie the information security services provider for the city or institution, eg the CISO’s office
- when compromise occurs — particularly on systems that the CISO’s office could not plan for — the CISO’s office is now forced to work in a reactionary mode. This is expensive and pulls resources from planned cybersecurity services
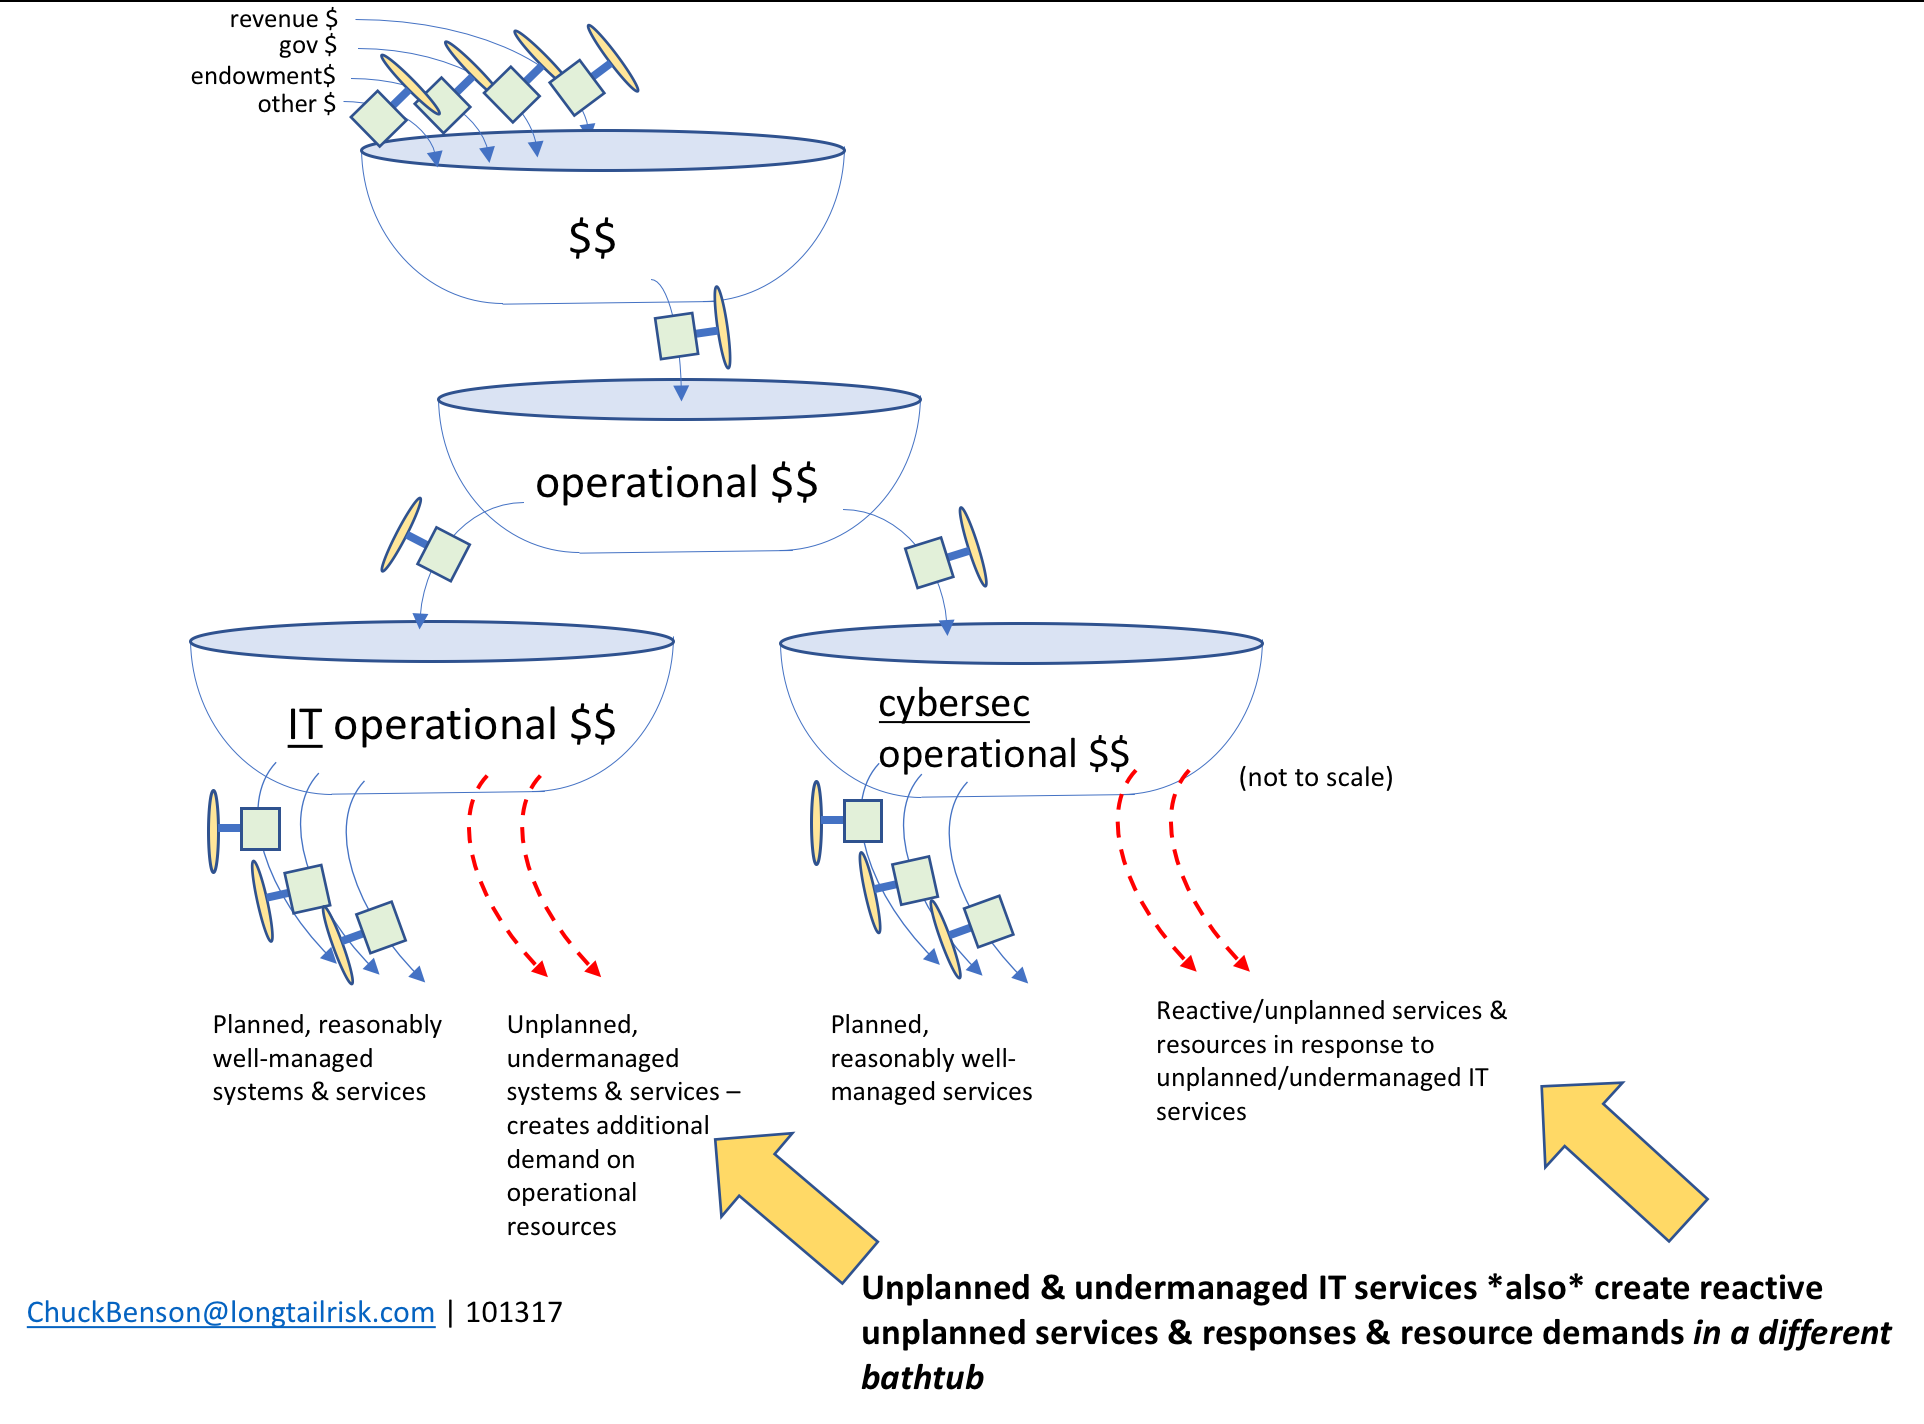
unplanned, under-managed systems also transmit their problems to the CISO’s office in the form of increased likelihood of systems compromise
IoT Systems often fall into the unplanned, under-managed category
Several aspects of IoT Systems deployments can contribute to them having high risk of being weakly planned and under-managed systems —
- lack of precedent for implementation & management
- cities/institutions don’t have deep experience with these systems
- true for all phases – systems selection, procurement, implementation, & management
- few, if any, peer cities/institutions from which to learn for systems expected to last years or decades (sufficient time hasn’t gone by)
- cities/institutions don’t have deep experience with these systems
- accountability and ownership unclear
- IoT systems span many organizations within a city or institution
- most organizations are not familiar or practiced at coordinating with each other in this role
- acquisition path – IoT Systems can come into the institution through many non-traditional paths
- these IoT Systems are rarely acquired by central IT
- even if acquired through central IT, traditional systems vetting approaches not sufficient
- no established vetting of IoT systems prior to purchase
- performance expectations unknown or unclear (see ownership above)
- the city or institutional department acquiring the system might not be the one supporting the system
- Newness and rapid evolution IoT Systems makes them hard to discuss, categorize, and plan for

the newness, novelty, and rapid evolution of IoT Systems will continue to make very susceptible to being under-managed systems
Rapid evolution of IoT Systems vs glacial pace of institutional change
While there are no silver bullets or magic technologies (and we shouldn’t spend much time looking for them) to address these added risks that IoT Systems bring, there are things that we can do now, or at least begin now, that can positively impact our risk exposure as institutions and cities. While we’re interested in mitigating risks that we have now from IoT Systems, the impact of IoT systems in our cities and institutions in the future will be much higher.
Some things that can be done now include —
- establish a set of criteria for your city’s or institution’s for IoT Systems
- identify IoT Systems ownership and accountability
- require before acquisition
- identify institutional language used to communicate traditional risk & incorporate that into IoT risk conversations, guidelines, and planning
- consider an IoT Systems oversight group for your city or institution
Making broad changes, perception changes, and policy changes in cities and institutions is arduous work that takes time, leadership, political capital, and patience. It is important that we begin now because this level of institutional change will likely take some time and the impact of not making the changes is increasing rapidly.
Supporting (& paying for) the network segments that support IoT Systems
Network segmentation is often promoted as the answer to IoT device and systems management and risk mitigation for an institution, city, or corporation. While segmenting networks is important, a subtle problematic aspect is that:
- segmenting networks takes work, energy, and resources in the form of initial investment and ongoing management and oversight
- numbers of network segments growth may well track with IoT device count growth – which, at least for the next few years, appears exponential
- cities and institutions may not be planning for increased network management resources to support IoT Systems deployments
Success criteria for an IoT System implementation
I use a two overarching component criteria to define a successful IoT System implementation for a city or institution —
1. ROI – does the system perform as expected for the actual (vs projected) costs of deployment and subsequent management
2. Cyber risk – did the implementation of the IoT System make the city or institution worse off in the course of deploying and operating the system?
A key aspect to both of these criteria is system manageability. An unmanageable or difficult to manage system costs more in terms of staffing, rework, repair/updating, and operational disruption. At the same time, a difficult to manage system can create cybersecurity vulnerabilities — both seen and unseen — and divert limited institutional resources from existing operational, cybersecurity and risk mitigation activities.
Similarly, as IoT Systems need to be manageable to positively (at least not negatively) affect ROI and institutional risk profile, the network segments supporting IoT Systems also need to be manageable.
Managing the network segments that support IoT Systems
Networks are no longer, “make this thing talk to that thing,” or “make these things talk to those things.” Network management requires a robust set of supporting system services that support consistent connectivity, resilience, real-time health reporting capabilities, and rapid network diagnostic capabilities.
In addition to these core network support services, for IoT Systems deployments, there is another overarching criteria needed to successfully support and manage networks that support IoT Systems —
The IoT System owner should be able to measure, monitor, and determine performance of the IoT System(s) at any particular point in time. This supports both the effort of determining ROI as well as providing visibility for cyber risk mitigation.
In the case of a city, the IoT System owner might be the city’s transportation department while the network provision is provided by or contracted through the city’s central IT organization. In the case of an institution, such as a research university, the IoT System owner might be an academic department purchasing and deploying an IoT System to support a research grant while the underlying supporting network segment is supported by the university’s central IT organization.
The IoT System owner should not be relying on the network provider to provide IoT application/system management and diagnostic services. IoT Systems are evolving so rapidly, it is very unrealistic to expect the network services provider to have the resources or wherewithal to keep up with the nuances of each new IoT System deployment, much less manage the performance expectations for a rapidly growing number of different IoT Systems.
Examples of IoT System/application-specific network services include:
- enumeration – how many things/devices are on this network?
- Is this count different from yesterday? By how much?
- identification – how many of these devices belong to my IoT System? Have I seen them before? Yesterday? a month ago? How rapidly is this changing?
- Is what I am seeing different from what I was expecting?
- (Did I know what I was expecting?)
- Is what I am seeing different from what I was expecting?
- Application-specific network device awareness and health
- Device heartbeat – are you there?
- Device performance specifics –
- Is device characteristic 1 returning a result within acceptable constraints? e.g. voltage level
- Is device characteristic 2 returning a result within acceptable constraints? e.g. device temperature,outside air temperature (OAT)
- Is device characteristic 3 returning a result within acceptable constraints? e.g. response time
- Is device characteristic n returning a result within acceptable constraints?
Accomplishing these requirements is not free. Some technology investment is needed, but more importantly, an organizational framework that supports this activity is necessary.
Growth of devices & growth of network segments
While we don’t know what the rate of growth of network segments is or will be, we can be pretty sure that it will continue to grow for the foreseeable future. This growth in network segments stems from at least two reasons, 1) network segments whether VRF’s, VLAN’s or other are easier to implement than they used to be, and 2) network segmentation is currently a popular strategy for addressing IoT Systems risk mitigation. (Regarding the latter, I believe that this is in part because we don’t know what else to do — when all you have is a hammer, everything looks like a nail).
There are multiple projections that IoT device count is growing at an exponential rate, such as this Ericsson Mobility Report that suggests a 23% annual rate of growth between 2015 and 2021 and this McKinsey report that suggests 15% – 20% annual growth by 2020. Related projections on IoT market growth can be even higher with annual growth over of 50%.
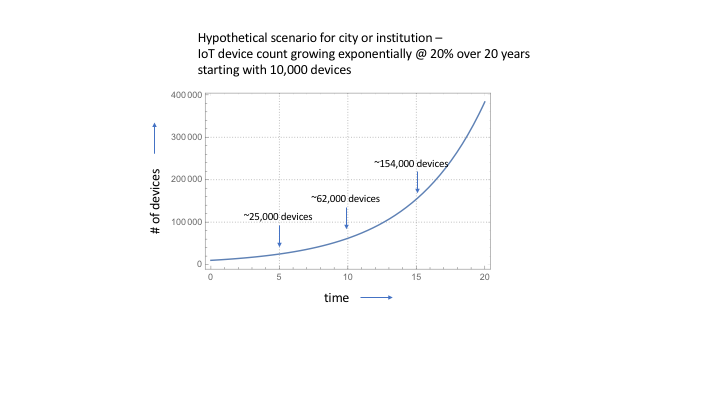
This ongoing steady (or more) growth year after year appears to be exponential growth. While IoT devices don’t compound each other like dollars do, the growth count curve still appears exponential. To borrow from the idea of compounding (exponential) growth in finance — we add 1 to the rate of growth and raise that sum to the number of years out that we want to project and then multiple that whole thing by the starting count —
So, let’s say that we start with 10,000 IoT devices in a hypothetical city or institution and that the growth rate in IoT device count over the next few years is 20% . That growth curve looks something like this —
(As a quick side note, we can see the Rule of 72 providing a rough estimate of the time it takes to double, about 3 1/2 years, at work here).
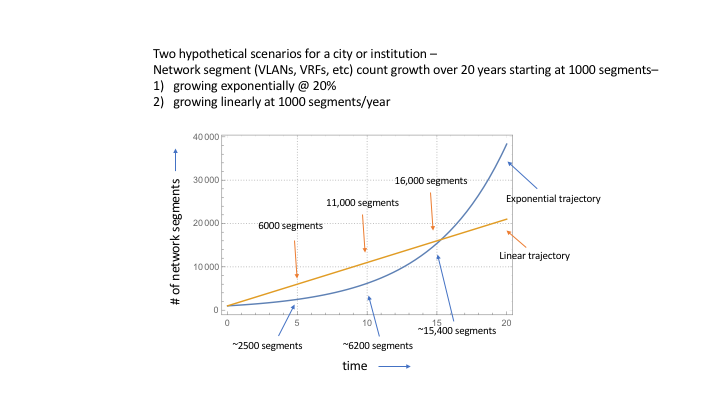
Now let’s say that there are currently 1000 network segments (VLANs, VRFs, etc) in that city or institution and consider two hypothetical growth trajectories — one exponential at the same rate as the device count growth rate and one linear growing at 1000 network segments per year.
While don’t know exactly what the network segment growth rate or trajectory will be for cities and institutions in particular or in aggregate, we can expect that count to continue to grow for the next several years. With that growth comes an increased demand on institutional and city resources. The question is, are we planning to resource that increase in demand?
Network segmentation management — impacts on ROI & institutional cyber risk
As mentioned earlier, to manage network segments for successful IoT systems implementations, at least two components are required — manageability of the network segment itself and manageability of the specific IoT System(s) on that network. Without both of these, the likelihood of an IoT System’s success for the city or institution is low. Without both of these, the city or institution can expect to feel negative impacts to ROI, the city or institution’s cyber risk profile, or more likely both.
Because both of these success components require current resourcing (eg staffing and tool investment) and planning for future resourcing, success is not guaranteed. If we’re not thoughtful about implementation, we could end up with broad portfolios of a rapidly growing number of unmanaged or under-managed networks. And that’s not good for any of us.
Developing counter-drone technologies not so easy
It’s not easy countering drones.
As fast as the drone industry is growing with hobbyist and commercial drone counts in the low millions by 2021, some anticipate that the counter-drone industry will be even larger with a combined annual growth rate of almost 26% between 2017 and 2021. Increasing the challenge, because of the multitude of factors involved in drone deployments and the many places of interest where drones can be deployed, whether individually or en masse, there are a surprisingly large number of scenarios to consider when developing and deploying counter-drone technologies and that in turn makes development and deployment of counter-drone technology particularly difficult.
There are obvious concerns amongst commercial, private, and government entities around risk stemming from drone use (to include property loss, privacy, injury, and potentially death) — such as drones over flying nuclear plants in France, drones snooping in the Olympics in Rio, drones with cameras outside 26th floor high rise apartments in Seattle, and many others. The challenge is that there are so many factors and so many interdependencies between those factors, that it can be hard to establish a shared conceptual framework around counter-drone approaches to even have a discussion about the concerns.
Already, many different approaches to counter-drone strategies
The broad and varied approaches of counter-drone technologies already on the market speak to the diversity of potential drone deployments and the areas in which they will operate – and which ostensibly there is a desire to be countered. For example, DroneShield’s DroneGun uses a rifle-like radio frequency jammer. Skywall uses a shoulder-fired drone-capturing net. The US Air Force is trying out net-filled shotgun shells by SkyNet and Malou Tech offers drone-nets-drone technology. And the US Navy and Marine Corps bring it on home with laser, aka directed energy, anti-drone approaches. The approaches are wide-ranging and I think we’ll continue to see even more evolution and many more companies in the space.
One approach for considering counter-drone systems
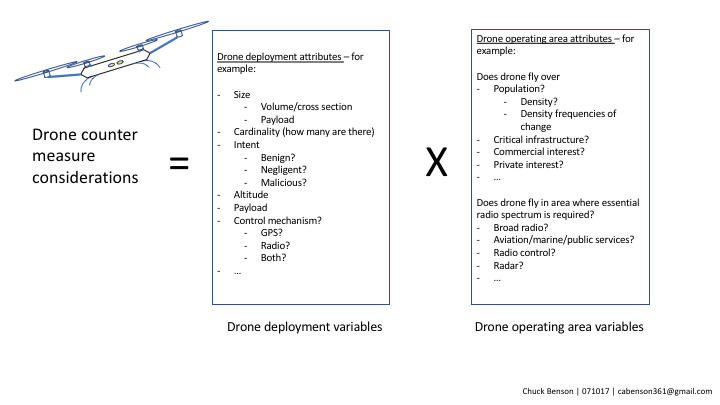
An approach discussed here splits out variables/attributes in drone deployments and operation from the variables/attributes of the operating area and what it contains into two separate sets of factors. This provides a broad base for conceptualizing counter-drone considerations. These two sets of factors are:
1. drone deployment attributes and
2. drone operating area attributes
In turn, each set of factors also has its own multiplicity of factors and interdependencies between them.
Drone deployment attributes
When considering how to counter drones, there are many factors that contribute to any particular drone deployment. A few of them are:
- Mass – How much does the drone weigh?
- Altitude – Is there a characteristic altitude of the deployment?
- < 50 feet?
- 50 – 200 feet?
- above 200 feet?
- varies?
- Potential Energy (PE)
- derives from mass & altitude
- Velocity
- Is there a characteristic speed of the drone(s)
- 5 mph?
- 5 – 20 mph?
- > 20 mph?
- Varies?
- Is there a characteristic speed of the drone(s)
- Kinetic Energy (KE)
- derives from velocity and mass of drone
- rotor rotation also contributes to KE
- Volume – What is the size of the drone?
- cross-section?
- diameter across opposing rotor tips?
- Cardinality
- Is it just one drone?
- 2 – 25 drones?
- 25 or more drones?
- Behavior >1 drone
- is the behavior coordinated?
- are they operating independently?
- sporadic?
- Intent – Is the operator intent:
- malicious?
- benign?
- negligent?
- operator-impaired?
- What is the payload of the drone?
- nothing?
- camera?
- explosive
- radiological?/chemical?
- combination?
Effects of factor interdependencies (aka Potential Energy can become Kinetic Energy)
As discussed, these factors can have substantial interdependencies between them as well. One of the interdependencies that is the most basic and seems to be often forgotten in conversation is that any drone with any altitude has Potential Energy. Regardless of motors, batteries, wind, payload, etc — just the fact that a mass (drone) has been raised to an altitude, it now has Potential Energy. The larger the mass and the higher the altitude, the more Potential Energy is converted to downward directed Kinetic Energy if a drone stops flying – for whatever reason. This may be important to anyone in the path of the dead drone’s earth-seeking trajectory.
Drone operating area attributes
The other part of the equation is what is the drone’s operating area? What are those things on the ground (or in the air) that have value? This could be the value that one puts on their individual privacy, to the value a corporation puts on a production facility, the value a city puts on a power substation, or the value of 50 people watching a little league game or 50,000 people watching an NFL game. Some operating area attributes/variables include:
- Does/do the drone(s) fly over a population?
- Population size – 10’s, 100’s, 1000’s, more?
- Density
- rural
- city
- high density congregation (eg professional sports game, parade, concert, ..)
- does the population density change, eg high when ball games & low when not
- Does/do drone(s) fly over/near critical infrastructure?
- power
- water – dams, reservoirs, …
- gas
- sewer
- nuclear
- Does/do drone(s) fly over/near schools, churches, hospitals …
- Does/do drone(s) fly in area of critical radio spectrum?
- broadcast
- police, fire
- aviation, marine
- military
Counter-drone Combinatorics
So let’s take a combination and create a constraint domain to illustrate the point. Where there is a broad range or spectrum of possibilities for a particular attribute, I break them down into three arbitrarily chosen sub-ranges. This will allow us to make the numbers smaller and a little more manageable and yet still see how the number of possibilities to consider can become quite large. You can, of course, break them down into whatever sub-ranges you would like and into as many sub-ranges as you would like.
Some counter-drone systems will naturally address multiple scenarios. However, to be effective and competitive in a rapidly growing market, the counter-drone systems developer has many flight profiles and many operating area profiles to consider.
Another factor in counter-drone technology development is the legal aspect. Examples include laws regarding national aviation system navigational system protection, individual state law, and civil lawsuits. This will likely be a substantially evolving landscape as drone technologies evolve and damaging events occur with real loss.
Dynamic landscape
When considering the factors involved in developing or evaluating counter-drone technologies, one approach that can be helpful is to think about both the characteristics of the drone (or drones) potential flight as well as the area in which the flight will occur and what’s valuable in that space.
With rapidly evolving and distribution of drone technologies, rapidly evolving counter-drone technological approaches, increased public awareness, and changes in local, state, and federal laws, I think investment, development, and deployment of counter-drone technology will continue to be a very dynamic realm.
FAA drone activity timeline
The FAA has found itself in a bold new role over the past few years regarding drone, aka Unmanned Aircraft System (UAS) policy, registration services, guidance, detection, establishment of permanent and temporary no drone zones, studies on drone/human collision risk and impact, and related areas. We can expect that this will continue to be a very active space over the next several years.
A timeline of some FAA drone activity since early 2015 is depicted below. The graph shows the total number of FAA News/Updates and Press Releases for that month. I used the FAA’s website news search engine to get these numbers. (I used the dates from search engine as the basis even though the actual event date might have differed by a few days in a couple of cases.) Some representative links to FAA News/Updates and Press Releases follow the graphic.
Super Bowl XLIX
Super Bowl 50
Super Bowl LI
Other No Drone Zone announcements —
DC kicks off No Drone Zone
Papal visit No Drone Zone press release
Airport drone detection system updates —
Denver International Airport & FAA partner on drone safety
Testing FBI drone detection systems @ JFK
Evaluating drone detection systems in Denver area
Testing drone detection system @ DFW
Other notable updates —
Drone registration site launched
San Francisco 49ers launch drone safety effort
Registration requirements go into effect
FAA responds to Court of Appeals reversal of registration requirements
Clearly, drone policy development and enforcement, drone detection and management systems, other drone-related tech, and messaging the same to the public is likely to a substantial growth area and effort for the FAA over (at least) the next several years.
Costing IoT Systems in cities & institutions
Determining the total cost of ownership, operation, and stewardship of IoT Systems for an institution or city has a number of considerations. Some of these considerations are shared with traditional enterprise systems and some are unique to IoT Systems. Lack of realization and acknowledgement of these costs can lead to disappointing and costly IoT Systems outcomes. These disappointing outcomes manifest themselves in the lost ROI of an IoT investment as well as negative impacts to the cyber-risk profile to an institution.
Listing from least complex/nuanced to more complex/nuanced …
- Costs to host servers, databases, & redundancy — whether under desks (hopefully not), in local data centers, or in the cloud
- Costs to support large numbers of geographically distributed ‘Things’ & devices (the T in IoT) & the different institutional organizations that may be involved (some of which may not see or realize the potential benefit to the institution but may bear at least some of its support costs)
- Costs stemming from the natural friction, sometimes small & sometimes large, between multiple historically disparate organizations within an institution as they attempt to coordinate, collaborate, and address problems of understanding to support the system
1. The more familiar part — application server, database server, & redundancy costing
This costing is more closely aligned with traditional enterprise application costing than other IoT systems costs. Application licensing and support agreements are a part of this aspect. Important additional costs to include, though, are: what are the costs of hosting those applications and databases? And what are the costs of supporting that hosting (e.g. who manages the relationships, the tickets, the problems, etc).
The applications servers or virtual machines (VM’s), database servers/VM’s, and redundancy servers/VM’s can be hosted in a local data center, shared data center, the cloud, or similar. Hosting or otherwise servicing these applications and supporting databases have their own costs. In addition to fees for the hosting, there’s also some cost to managing the vendor relationship and agreement/contract.
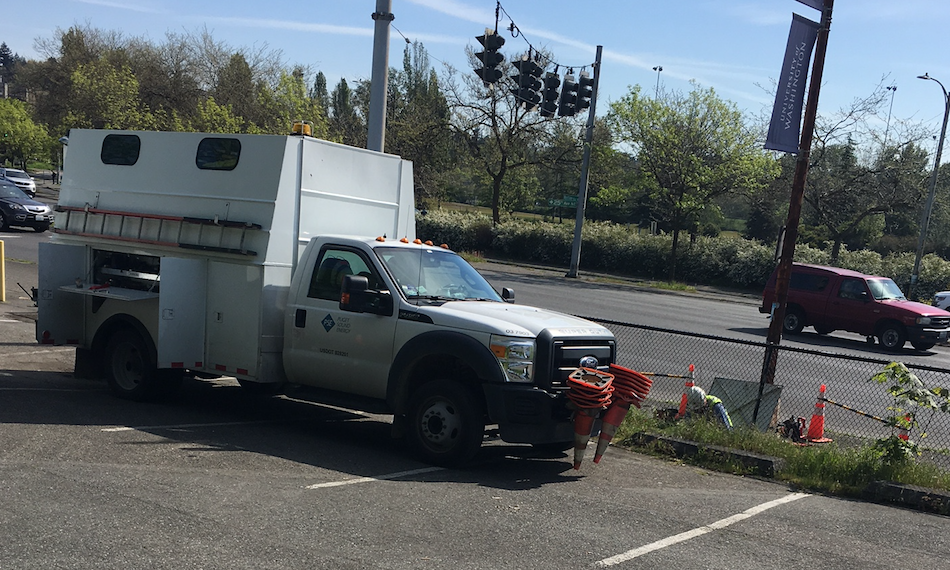
2. A guy, a truck, and a ladder – a less obvious part of IoT System costing
Imagine an institution or city that implements 500 smart street lights that provide lighting, sense movement, maybe samples air quality, and possibly monitors and reports street or underground vibration. There will be some failure rate amongst the components in any single device/endpoint and some failure rate across the total number of installed devices/sensors – the T’s in IoT.
In this hypothetical scenario, troubleshooting and/or repair means:
- deploying 1 or more skilled tradespeople
- 1 or more for the work & possibly another as a safety observer
- rolling a truck or trucks
- with associated vehicle/fleet/fuel costs
- spending 1-2 hours just to get to the point of troubleshooting/repair
- 2 – 4 hours troubleshooting/repair
- 1-2 hours wrap up and return
For this hypothetical example, let’s say the skilled tradespeople involved make $60/hour and their benefit load (expense to institution or city) is 25% for a total $75/hour expense. So, disregarding fleet and related costs, one estimate might be:
(2 hrs prep + 4 hrs on site troubleshooting/repair + 2 hrs recovery) x 2 tradespeople x $75/hr = $1200 per support event
Continuing on the thread, let’s say there’s a 10% / year failure rate (or required hardware/software update rate) of at least some component on a single device or Thing (T in IoT). That would be:
500 devices x 10% repair or troubleshoot rate/year x $1200/event = $60,000 / year
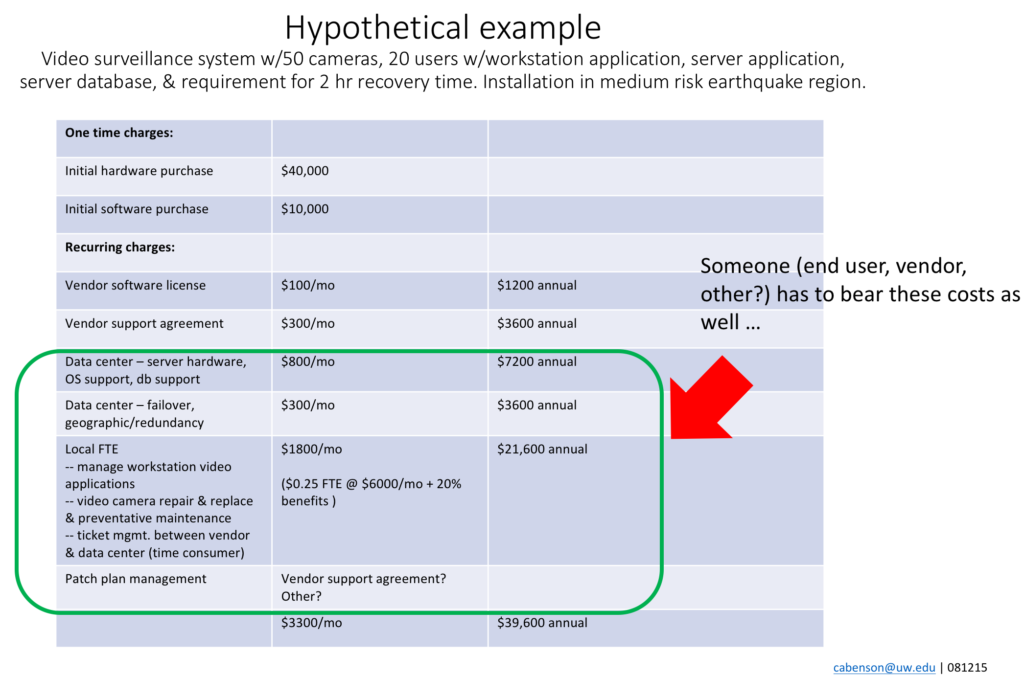
That dollar figure starts to become non-trivial. And that’s just one IoT System. Cities and institutions will have many, a portfolio, of well-managed or less-well-managed IoT Systems. Another hypothetical example is in the example below —
3. The insidious part — loss from organizational friction
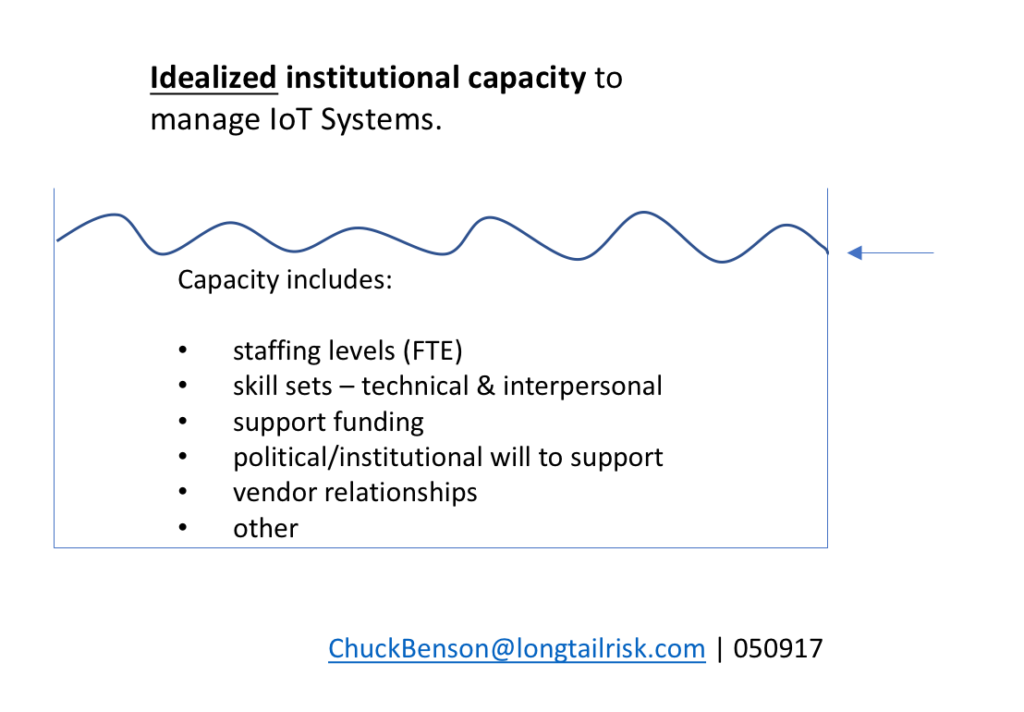
The least apparent and possibly most costly aspect is the loss that occurs from the coordination and collaboration required between organizations and the oversight needed across all of them for a successful implementation. In the idealized scenario of institutional capacity, there is a homogeneous set of resources that include components such as available staffing levels (FTE), requisite skill sets (technical, operational, and interpersonal), support funding, political/institutional will to support the implementation and operation of the IoT System, vendor relationships, and other.
In practice, however, this institutional capacity is comprised of many different organizations and the interrelationships between them. While collaboration and inter-organizational cooperation is typically universally lauded, we all know from personal and professional experience that often collaboration between institutional organizations does not in fact work so well. Research has also been done on this phenomena where, “the discrepancy between the promise of collaboration and the reality of persistent failure” is studied (Koschmann).
Wherever two or more organizations interact with each other, some sort of friction or system loss is present. Metaphorically similar to the 2nd law of thermodynamics, not all of the time, energy, resources put into ostensible institutional IoT System management capacity will be used, or can be used, to do the expected work. In the organizational friction example, losses can come from a multitude of sources where the number of friction sources and the intensity of each can vary from organizational relationship to organizational relationship. Examples of this sort of friction/system loss and resultant loss in expected institutional capacity include:
- limited administrative resources (planning, meetings, time, support, etc)
- lack of precedence for coordination/collaboration for IoT Systems, i.e. no patterns to follow
- misunderstanding / problems of understanding between organizations
- misalignment of objectives between organizations
- conflicting obligations to different scopes, projects, and organizations
- lack of shared objectives
- different expectations of effort
- different expectations of data
- cultural differences
- political objectives supporting different time frames
- other
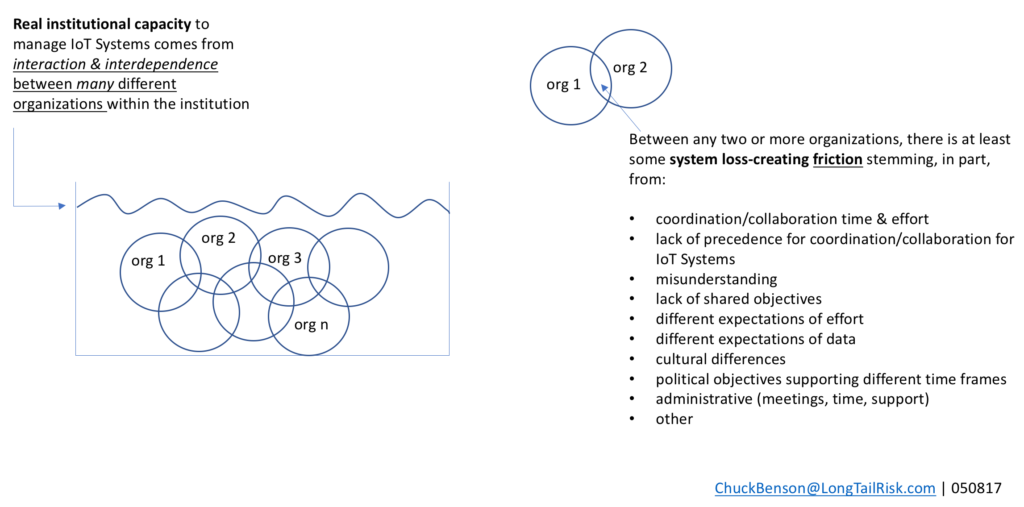
real capacity stems from multiple organizations with multiple relationships and the friction between
The insidious part is that while the friction between any two organizations, may be small and possibly not obvious, these small instances of organizational friction aggregate across the whole institutional and IoT System implementation effort. Further, not all relationships are one-to-one. There are often many relationships where many organizations are involved. Likening to Newton’s Three Body Problem, adding a third planet, billiard ball, or organization can significantly increase the complexity of analysis, prediction/forecasting, and the ability to get work done.
Costing differently
In practice, capturing all of these costs can be challenging. #1 — application and database licensing and hosting costs is relatively the most straightforward and for which we generally have the most experience, but that doesn’t mean it’s effortless. We have less experience with #2 for IoT Systems — the guy, truck, & ladder costs — but that support cost can be estimated and the failure rates of devices and device components can be estimated. Costing #3 — aggregated inter-organizational friction is, by far, the most difficult and possibly the most impactful — in part because of its magnitude and in part because of the uncertainty it introduces.
The import thing, I believe, is to acknowledge all of these components, compute and estimate what we can, and work to allow for and hopefully prepare for the unique uncertainty that selecting, procuring, implementing, and managing IoT Systems brings. If we do this work, we have our best chance of reaching anticipated ROI and not degrading (possibly even enhancing) the risk profiles of our cities and institutions.
Can we manage what we own? — IoT in smart cities & institutions
The rate of growth of IoT devices and systems is rapidly outpacing the ability of an institution or city to manage those same devices and systems. The tools, capacities, and skill sets in institutions and cities that are currently in place were built and staffed for different information systems and technologies — centralized mail servers, file sharing, business applications, network infrastructure support, and similar. Some of these systems still exist within the enterprise and still need robust, effective support while others have moved to the cloud. The important consideration is to not assume that toolsets developed for traditional enterprise implementations are appropriate or sufficient for IoT Systems implementations.
Working from the outside in
Starting with the outer ring, the number of ‘things’ — the T in IoT — is rapidly growing within institutions and cities. From my perspective, an IoT ‘thing’ is a device that computes in some way, is networked, and interacts with its local environment in some way. Further, these systems may be acquired via non-traditional methods. For example, a city’s transportation department may seek and acquire a sensor, data aggregation, and analysis system for predictive maintenance for a particular roadway. This system might have been selected, procured, implemented, and subsequently managed independently of the organization’s traditional central IT organization & processes. Complex and high data producing systems are entering the institution/city from a variety of sources and with little formal vetting or analysis.
Can we even count them?
Because of the rapid growth of IoT devices and systems in concert with alternative entry points into the city/institution, even counting (enumerating) — these devices — which can compute with growing ability and are networked — is increasingly difficult. This lack of countability in itself is not so bad, it’s just a fact of life – the trouble comes when we base our management systems on the assumption that we can count, inventory, much less manage all of our devices.
What do we know about the devices?
Do we have documentation and clarity of support for the tens, hundreds, thousands (or more) of devices. What do they do? How are they configured? Have we set a standard for configuration? How do we know that that standard is being met? What services do we think should be running on the devices? Are those services indeed running on them? Are there more services than those required running? Are there processes for sampling and auditing those device services over the next 12 – 36 months? Or did we install them, or have them installed, and simply move onto the next thing?
We can borrow from the construction industry and ask for as-built documentation. What actually got installed? What are the documents that we have to work with to support this system? Drawings? IP addresses? Configuration documents for logins, passwords, open ports/services?
What is manageable?
If we are in the fortunate position to be able to actually count these computing/networked/sensing devices with reasonable accuracy and we know some (enough) things about the devices, then the next question is — do we have the resources — staffing, time, skill sets, opportunity cost, etc — to actually support the devices? Suddenly in smart cities, smart institutions, smart campuses, we’re installing things, endpoints, in the field that may require regular updating (yearly, monthly, …) — and this occurs between the customer network with its protocols/processes and the vendor system that is proposed. Not all (possibly substantial) device updating can be accomplished effectively remotely.
Another challenge is that often the organizations that are charged with staffing, installing, and supporting these deployed IoT devices, such as smart energy meters or environmental monitoring systems, are more accustomed to supporting machines that last for years or decades. Such facilities management organizations have naturally built their planning, repair, and preventative maintenance cycles around longer periods. For example, a centrifugal fan in a building might have a projected lifespan of approximately 25 years, soft start electric motors 25 years, and variable air volume (VAV) boxes with expectancies of 25 years.
Similarly, central IT organizations generally are not accustomed to running out into the field with trucks and ladders to support 100’s, 1000’s, or more of computing, networked devices in a city or institution. So the question of who’s going to do the actual support work in the field is not clear in terms of capacity, skill sets, and costs.
Actually managing the things
So, if we have all of the above — and that subset gets smaller and smaller — have the decisions been made and priorities established to actually manage the devices? That is, to prioritize, risk manage, and develop process to manage the devices in practice? There’s a good chance that manageable things won’t actually be managed due to lack of knowledge of owned things, competing priorities, and other.
On not managing the things
It is my opinion that we will not be able to manage all of the ‘things’ in the manner that we have historically managed networked, computing things. While that’s a change, that’s not all bad either. However we do have to realize, acknowledge, and adjust for the fact that we’re not managing all of these things like we thought we could. Thinking we’re managing something we’re not is the biggest risk.
We’re moving into a world of potentially greater benefit to the populace via technology and information systems. However, we will have to do the hard work of being thoughtful about it across multiple populations and realize that we’re bringing in new risks with some known — and unknown — consequences.

