Tag Archives: growth

Can we manage what we own? — IoT in smart cities & institutions

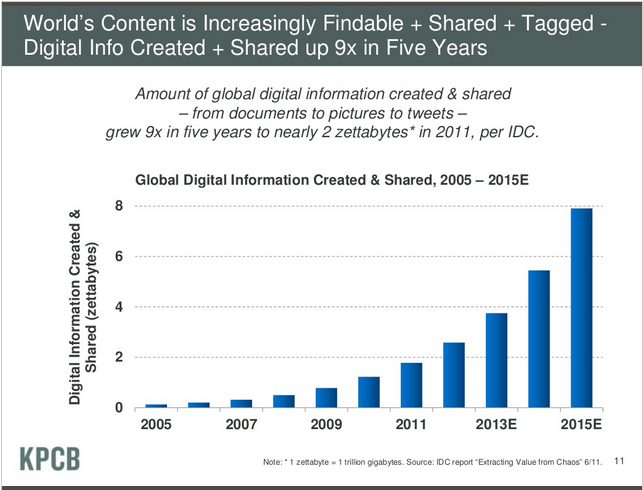
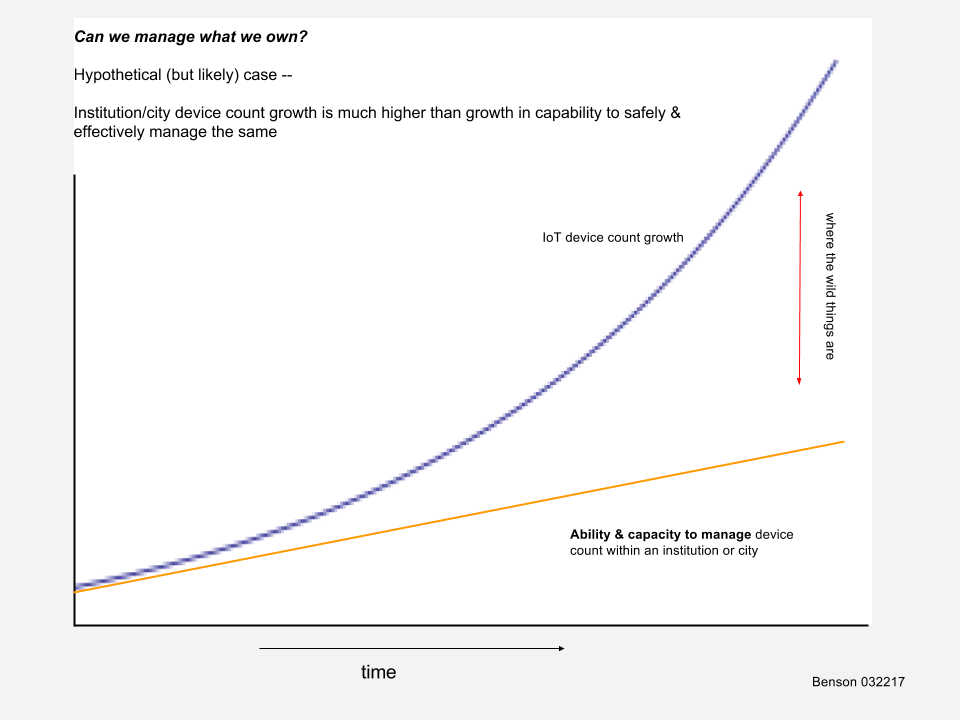
The rate of growth of IoT devices and systems is rapidly outpacing the ability of an institution or city to manage those same devices and systems. The tools, capacities, and skill sets in institutions and cities that are currently in place were built and staffed for different information systems and technologies — centralized mail servers, file sharing, business applications, network infrastructure support, and similar. Some of these systems still exist within the enterprise and still need robust, effective support while others have moved to the cloud. The important consideration is to not assume that toolsets developed for traditional enterprise implementations are appropriate or sufficient for IoT Systems implementations.

What's manageable- 032217

things are increasing faster than the ability to manage those things

Working from the outside in

Starting with the outer ring, the number of ‘things’ — the T in IoT — is rapidly growing within institutions and cities. From my perspective, an IoT ‘thing’ is a device that computes in some way, is networked, and interacts with its local environment in some way. Further, these systems may be acquired via non-traditional methods. For example, a city’s transportation department may seek and acquire a sensor, data aggregation, and analysis system for predictive maintenance for a particular roadway. This system might have been selected, procured, implemented, and subsequently managed independently of the organization’s traditional central IT organization & processes. Complex and high data producing systems are entering the institution/city from a variety of sources and with little formal vetting or analysis.

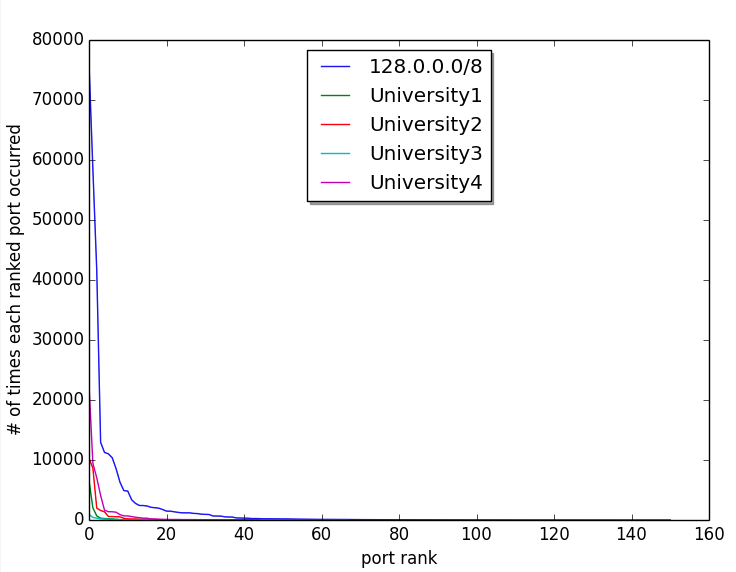
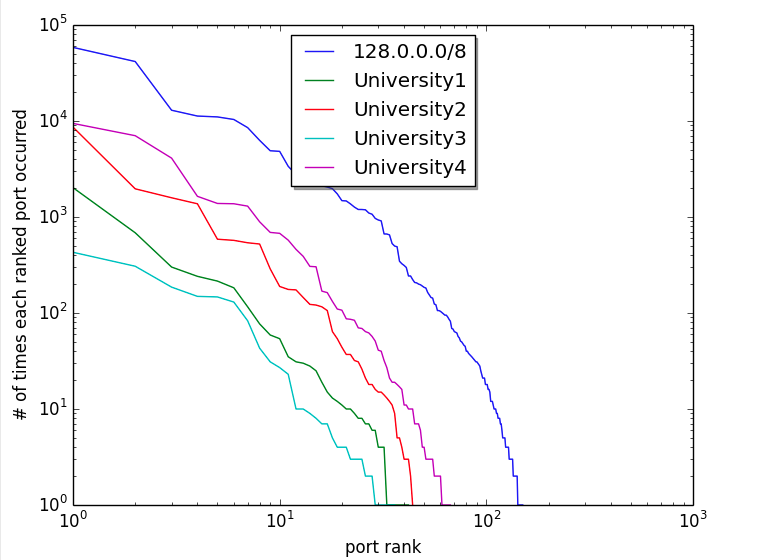
Can we even count them?

Because of the rapid growth of IoT devices and systems in concert with alternative entry points into the city/institution, even counting (enumerating)  — these devices — which can compute with growing ability and are networked — is increasingly difficult. This lack of countability in itself is not so bad, it’s just a fact of life – the trouble comes when we base our management systems on the assumption that we can count, inventory, much less manage all of our devices.

What do we know about the devices?

Do we have documentation and clarity of support for the tens, hundreds, thousands (or more) of devices. What do they do? How are they configured? Have we set a standard for configuration? How do we know that that standard is being met? What services do we think should be running on the devices? Are those services indeed running on them? Are there more services than those required running? Are there processes for sampling and auditing those device services over the next 12 – 36 months?  Or did we install them, or have them installed, and simply move onto the next thing?

We can borrow from the construction industry and ask for as-built documentation. What actually got installed? What are the documents that we have to work with to support this system? Drawings? IP addresses? Configuration documents for logins, passwords, open ports/services?

What is manageable?

If we are in the fortunate position to be able to actually count these computing/networked/sensing devices with reasonable accuracy and we know some (enough) things about the devices, then the next question is — do we have the resources — staffing, time, skill sets, opportunity cost, etc — to actually support the devices? Suddenly in smart cities, smart institutions, smart campuses, we’re installing things, endpoints, in the field that may require regular updating (yearly, monthly, …) — and this occurs between the customer network with its protocols/processes and the vendor system that is proposed. Not all (possibly substantial) device updating can be accomplished effectively remotely.

Another challenge is that often the organizations that are charged with staffing, installing, and supporting these deployed IoT devices, such as smart energy meters or environmental monitoring systems, are more accustomed to supporting machines that last for years or decades. Such facilities management organizations have naturally built their planning, repair, and preventative maintenance cycles around longer periods. For example, a centrifugal fan in a building might have a projected lifespan of approximately 25 years, soft start electric motors 25 years, and variable air volume (VAV) boxes with expectancies of 25 years.

Similarly, central IT organizations generally are not accustomed to running out into the field with trucks and ladders to support 100’s, 1000’s, or more of computing, networked devices in a city or institution. So the question of who’s going to do the actual support work in the field is not clear in terms of capacity, skill sets, and costs.

device count vs mgmt ability 032217-3

Actually managing the things

So, if we have all of the above — and that subset gets smaller and smaller — have the decisions been made and priorities established to actually manage the devices? That is, to prioritize, risk manage, and develop process to manage the devices in practice? There’s a good chance that manageable things won’t actually be managed due to lack of knowledge of owned things, competing priorities, and other.

On not managing the things

It is my opinion that we will not be able to manage all of the ‘things’ in the manner that we have historically managed networked, computing things. While that’s a change, that’s not all bad either. However we do have to realize, acknowledge, and adjust for the fact that we’re not managing all of these things like we thought we could. Thinking we’re managing something we’re not is the biggest risk.

We’re moving into a world of potentially greater benefit to the populace via technology and information systems. However, we will have to do the hard work of being thoughtful about it across multiple populations and realize that we’re bringing in new risks with some known — and unknown — consequences.

Power laws & power plants – tackling IoT systems risk classification

Do aspects of Shodan data – data about Internet of Things (IoT) devices and systems – demonstrate ‘long tail’ qualities? Data showing these qualities sometimes also go by the name of having a ‘Zipf distribution‘, following a power law, or behaving according to the Pareto principle. If there is in fact a reoccurring relationship or curve that occurs across aspects of IoT data, that might offer some insights into how to categorize or classify aspects of IoT systems. For managing risk around IoT systems implementations, our current ability to classify and categorize these systems is sorely missing. Potentially, it could also offer predictive capabilities regarding elements of the Internet of Things phenomena.

To take an initial swing at it, I narrowed the question down to:

Do the frequencies of occurrences of particular ports (services) in an organization, or other Shodan data set, behave in a repeatable way?

Long tails & power laws

The concept of long tail behavior was popularized in Chris Anderson’s 2004 Wired article and it has entered popular vernacular in the years since. What Anderson articulated was that aspects of many systems or sets of data are characterized by the observation that there are a lot of a few types of things and then a rapidly dropping number of other types of things — but there are a lot of those other types. Anderson used the example of record sales — there are a relatively few mega-hit songs, but there are a lot of non-hit songs and record companies were learning how to capitalize on this observation. This is the long tail.

George Zipf

George Zipf

Another example is early ‘long tail’ work attributed to George Zipf with his analysis of word distribution frequencies in any particular text. He found that if you:

  1. counted how often each word appeared in a text
  2. ranked each word so that the word with the highest count got the highest rank (i.e. #1) and down from there
  3. plot the results in a graph

then you find a curve that shows that a few words show up a lot.


For example, the words ‘the’, ‘be’, and ‘to’ show up a lot (1st, 2nd, & 3rd in a ranked list) and words like ‘teeth’, ‘shell’, or ‘neck’ shows up around 1000 places down the list. From the first few spots in the ranked list, the frequencies of other ranked words fall off quickly — but there a lot of those ‘other’ words. Further, this curve is a power law which looks a bit like y = 1/x. Variations include multiplying 1/x by something and raising x to some exponent. (For Zipf relationships, this exponent is often close to 1).

Yet other Zipf relationships are found in studies of populations of cities data and website references.

citypopulationdata

Ranking city population sizes also follows Zipf-like relationships (the loglog plot is fairly linear)

Power law relationships in IoT data?

John Matherly, founder of Shodan, has been collecting data on IoT sorts of devices for years. He scans all publicly accessible IP addresses for particular ports for Internet of Things or Industrial Control systems including things like power plants, video cameras, HVAC systems, and others.

I have a particular interest in how IoT data shows in higher education IP address spaces, so I analyzed large subsets of data in some of those institutions. To do this I queried for data from those publicly facing IP spaces in the organization and exported it to a json format. (Shodan also offers an XML version, but it is deprecated). From the downloaded data, I used Python scripts to clean the data a bit, count how often each port occurred, and then rank them by organization. Finally, I used the Python module matplotlib to plot the results.

This is similar to the word frequency analysis approach above where, for a set of data:

  1. Count the number of occurrences of each port (service)
  2. Rank the ports so that the port (service) that occurs most frequently gets the highest rank
  3. Plot the results

Like word frequency data in Zipf studies, a plot of frequency of occurrence of each port vs rank of each port’s frequency yields a curve that drops off so fast that it is hard to discern nuanced information. However, the fact that it does drop off so fast let’s us know something at a glance that is similar to Zipf data — a very few ports occur most often and a lot of ports have a few occurrences.

nonlogmultipleuniversity

4 universities and 1 (organizationally) arbitrary & large) set of IP addresses on normal (non-log) plot

What gets more interesting visually is to plot that same data on a log log scale. This kind of brings the curve out to where it’s easier to see.

Zipf-like data can follow the relationship of y = 1/x almost exactly for much of the range. (This is part of why word frequency, city population data, etc is so intriguing.) So when plotted on log log, much of the line looks almost straight – slope of 1 (ish).

A log log plot of university IoT data doesn’t yield a straight line, but sort of a bulging out line. If you were standing on the graph way out to the right and up and looking toward the origin, it would appear convex. So this isn’t Zipf in the traditional sense — the log log plot is not linear.

However, they do look similar. University1 looks roughly like University2. University2 like University3, and University3 like University4, etc. The curve roughly retains its shape regardless of the school, though the school sizes are different (or at least the number of public IP addresses are different).

loglogmultipleuniversity

4 universities and 1 (organizationally) arbitrary & large set of IP addresses on log log plot

Maybe the organization doesn’t matter?

Also plotted are the results from a search on all of the IP addresses in the 128.0.0.0/8 range (using CIDR notation).  This curve, though bigger and slightly smoother, has roughly the same shape as the others. The main thing that separates it from the others appears to be magnitude (number of IP addresses sampled). It appears that there is nothing particularly unique about an organization that drives this curve shape — a similar shape appears even if a set based on a numerical range, regardless of organization, is chosen.

It will be interesting to see if, as IoT device count grows, the curve changes shape. Will the set of IoT devices across the globe continue to communicate mostly over the same ports/services as those currently in use, keeping the same shape? Or will new ports/services/enumerations show themselves as IoT device proliferation continues, changing the shape?  By analyzing ranking relationships over time and between organizations, this approach could provide some insight into helpful categorizations for risk analysis.

Internet Trends – Mary Meeker @ All Things Digital Conference Today

Some select slides from Mary Meeker/KPCB presentation at All Things Digital Conference:

China's smartphone growth over 50% faster than US

China’s smartphone subscriber growth over 50% faster than US

Reaching for the phone

Reaching for the phone 150 times a day …

Internet user growth - emerging markets dwarf others

Internet user growth – emerging markets dwarf others

A zettabyte??

A zettabyte?? (it’s the new terabyte — 1 zettabyte = 1 billion terabytes.) yowza.

Video upload in hours per minute ...

Currently over 100 hours per minute of video being uploaded to YouTube alone

Emerging markets seem to share a lot more

Some surprising data on online social sharing