Category Archives: IT Risk Management
Creating simple information risk management heat maps
Visualization is a powerful tool for simple information risk analysis. The simple of act of placing risks in spacial relationship to each other allows a quick overview of essential elements of your risk profile. As importantly, it allows you to communicate that simple risk profile to others that aren’t as versed in information security, IT, and information management. A popular risk visualization tool is an information risk heat map.
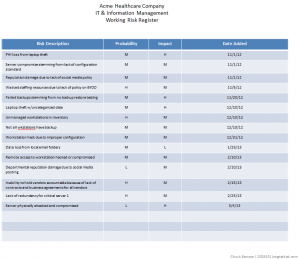
A couple of posts ago, I talked about creating a simple risk register. In a nutshell, this is a list of things that can go wrong in the IT and information management part of your business with an estimate of how bad it would be and how likely you think it is to happen. An example might be as simple as, “business shutdown for greater than 3 days because no backup for critical data — medium probability, high impact” or “data inaccessibility because of failure of cloud services provider — medium probability, medium impact.”
As a reminder, keep your analysis simple for probability and impact of event. I suggest just Low, Medium, or High to start. As a small or medium-sized company, you probably don’t have a lot of data to drive estimates for probability, so just make your best educated estimate. For example, if I’ve got a server with a RAID 5 configuration, I think the chances of 2 disks failing simultaneously (resulting in data loss) is Low. Similarly, for impact, keep the analysis of impact pretty simple to start. For example, amount of time offline might be a guideline for you — maybe 4 hours or less offline is Low impact for you, 4 hours to 2 days is Medium, and greater than 2 days is High. How you define impact is a statement of your business’s “risk tolerance” and will vary from business to business. The main thing to remember is to not make it overly complicated.
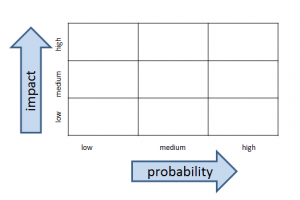
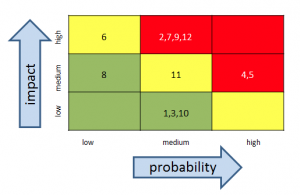
The heat map is going to be a simple 3 x 3 grid with probability on one axis and impact on the other. The cells inside the grid will contain the actual risks.
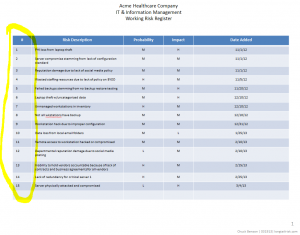
In the original risk register example, there were four columns: risk description, probability, impact, and then a column for date added. To create the heat map, we’re going to add one more column to the far left simply called Risk #. This is just a number to identify the risk. It doesn’t indicate any sort of risk priority.
Once you have the risk register that includes the Risk # column (which is just an index to the risk description and not a priority), start your heat map by creating a 3 x 3 grid with probability of the event happening on one axis and impact of the event of the other axis.
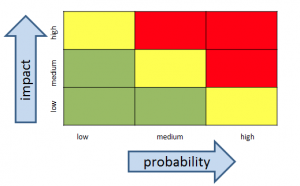
If you’d like add some color:
Finally, add the risk index #’s from your risk register
Once people orient to axes on the heat map, their eyeballs generally go directly to the upper right hand corner of the heat map where the higher impact and probability events are. This is not a bad thing.
With your simple heat map, and without a lot of work, you now have some insight into your operation’s risk profile and are in a better position to make informed business decisions.
Have you created information risk registers or information risk heat maps before? What did you use for criteria for impact?
Coursera and University of Washington offering online courses on Information Risk Management
What Floyd the Barber knew about information risk management
The Mayberry Model
Watch the till and lock the door at night. If you were opening a small business 30 years ago, your major security concerns were probably to keep an eye on the till (cash register) during the day and to lock the door at night. It reminds me a little bit of the Andy Griffith Show which ran in the 1960’s about a small fictional town called Mayberry RFD in North Carolina. Mayberry enterprises included Floyd’s Barbershop, Emmett’s Fix-It Shop, and Foley’s Grocery.
Floyd didn’t need a risk management program, much less an IT risk management program to run his business. It was pretty easy to remember — watch the till and lock the door. He could also easily describe and assign those tasks to someone else if he wasn’t available. Further, it was fairly easy to watch the till: Money was physical — paper or metal — and it was transferred to or from the cash drawer. He knew everyone that came into his shop. Same for Emmett and his Fix-It Shop. Plus they had the added bonus of a pleasant bell ring whenever the cash drawer opened. This leads us to the MISRMP (Mayberry Information Security & Risk Management Plan).
Mayberry Information Security and Risk Management Plan:
- Watch the till
- Lock the door at night
- Make sure the cash register bell is working
Today’s model
Fast forward to a small business today, however, and we have a different story. Today, in our online stores selling products, services, or information, there is no physical till and probably little to no physical money. There are online banks, credit cards, and PayPal accounts and we really don’t know where our money is. We just hope we can get it when we need it.
There are not actual hands in the till nor warm bodies standing near the till when the cash drawer is opened. There is no soft bell ring to let us know the cash drawer just opened. We don’t know the people in the store and they don’t go away when the front door is locked. Our customers shop 24/7.
Further, instead of a till with a cash drawer, our businesses rely on very complex and interconnected equipment and systems — workstations, servers, routers, and cloud services — and we don’t have the time to stop and understand how all of this works because we’re busy running a business. Floyd’s only piece of financial equipment was the cash register (and Emmett could fix that if it broke).
This new way of doing business has happened pretty fast. It is not possible to manage and control all the pieces that make up our financial transactions. We also have a lot more financial transactions. While the Internet has brought many more customers to our door, it has also brought many more criminals to our door. Making the situation even more challenging, we largely don’t have the tools in place to manage our information risks.
What Floyd knew (and we don’t):
- who his customers were (knew them by face and name)
- what their intentions were (wanted to purchased a haircut or shave or steal from the till)
- where his money was (in the till, in the bank, or in his pocket while being transferred from the shop to the bank)
- when business transactions occurred ( 9:00 – 5:00 but closed for lunch and closed on Sundays)
- what was happening in his store after hours (nothing)
That is to say, Floyd had much less business uncertainty than we must contend with today. He could handle most of his uncertainty by watching the till and locking the door at night. Our small and medium sized businesses today, though, are much more complex, have much higher levels of uncertainty, and need be risk managed to allow us to operate and grow.
As Floyd managed his security and risk to operate a successful business, so must we — ours is just more complicated.
What are the 3 biggest IT & Information Management risks that you see affecting your business?
Where to begin with IT risk management
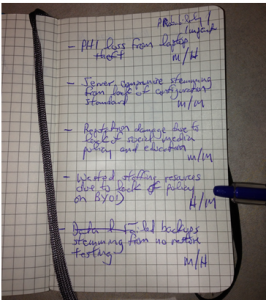
Starting an IT risk management program in the traditional sense appears daunting, and usually is, to a small or medium-sized business. This is one of the reasons that they often don’t get started. To make the insurmountable surmountable, start a simple risk register. If you haven’t already, start one today. Napkins, yellow legal pads, Moleskine notebooks, Evernote notes, etc all work to start.
Starting and developing a risk register will:
- increase your situational awareness of your environment
- serve as the basis of a communication tool to others
- demonstrate some intent and effort towards due care to auditors and regulators
- provide the basis of future more in depth analysis (as resources allow)
The simplest risk register will have three columns — a simple risk description, a likelihood of the event happening, and the impact of it happening. (Adding a fourth column that contains the date of when you added the risk can be helpful, but is not required).
Start with writing down the risks as soon as you think of them. If you haven’t done this before, several will probably pop into your head right off. The act of writing something down is deceptively powerful. It makes you articulate the problem and maybe revisit a couple of your assumptions about the problem. That said, don’t go nuts analyzing any particular risk when you start. Just get the core idea down, maybe something like, “PII loss resulting from laptop theft” or “reduced support effectiveness because of lack of BYOD policy.”
After you’ve got a dozen or so, take a break for now (you’ll add more later), and review the whole list. Make two columns next to this list. Label one column ‘probability’ and the other column ‘impact’. Next to each risk, write down what you think the likelihood of that event occurring — just High, Medium, or Low. Nothing fancier than that. Same thing with impact — how bad would it be if this event occurred? What’s the impact? Again, just High Medium or Low.
When you have a few minutes, you can structure this a little bit more by putting this in a table. I like using Powerpoint or Keynote over Excel/Numbers for this stage. By using Powerpoint’s cartoonish and colorful tables, I tend to stay oriented to the fact that I’ll be communicating these risks (or some of these risks) later on. If I use Excel for this, I tend to get overly analytical and detailed. It starts to become more of a math problem vs something that I will be communicating to others.
Keep in mind, that it is very easy to over-design beyond the point that is useful to you right now. And you want it to be useful to you right now. At this point, you are creating a simple document that informs you in that brief moment of time that have to look at it. You don’t want a document that taxes you right now. It needs to give you a quick easily digestible and broad view of your risk picture. If the document gets too complicated or goes into too much detail, you increase the likelihood that you won’t pick it up again tomorrow or in a week or in a month.
In an upcoming post, we’ll create a simple visualization tool, called a heat map, that can be very helpful in providing a profile of your risk picture.
Do you currently use a risk register now? How did you create it? How do you maintain it?
Companies in the long tail & information risk
I contend that at least half of the companies in the US and other industrialized countries are critically overexposed to IT & Information Management risk and that this population of highly vulnerable companies is primarily compromised of medium and small sized companies, aka SME’s (Small and Medium sized Enterprises).
The problem is that the techniques and approaches in the fairly fledgling field of IT risk management usually are developed from or apply to very large companies that differ significantly in scale from SME’s.
Often the IT risk management techniques envisioned for large companies don’t scale down to SME’s. For SME’s, quantities of analytical data, staffing, operational bandwidth are all in short supply. Also, because of their smaller size, impacts such as total dollar loss from adverse information events such as hacking, malware, fraud, etc are usually lower than that of large companies and compromises, breaches, disclosures can be less newsworthy per event. However, there are a large number of small and medium size companies.
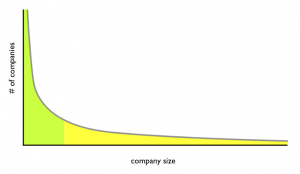
It turns out that company sizes in industrial countries follow the Zipf distribution where a few very large companies coexist with a lot of much smaller companies. This is a similar distribution to what Chris Anderson popularized in his Wired magazine article The Long Tail in 2004. For example, Anderson talks about the record industry historically focusing on the revenue generated from hits (few in number but large in revenue) and missing the fact that there were many non-hit songs generating substantial revenue when viewed in aggregate. Similarly, there are a few really big companies and a lot of smaller companies. This high number of smaller companies (like the number of non-hit songs) is the part known as the long tail. And this is the part suffering the overexposure to information risk because of a lack of tools, methods, and shared approaches between companies.
The challenge is that many of the information risk management techniques and processes used by the relatively few very big companies don’t work well for smaller companies. This is due largely, but not entirely, to resource constraints of smaller companies. Staff in smaller companies frequently wear multiple hats and are eyeball-deep in sales, innovation, marketing, infrastructure development, and management of risk is often down the priority list.
As a whole, we end up with part of the population, the few large companies, with reasonable IT risk management capabilities and the other part, the medium and small companies, with poor IT risk management capabilities.
For the sake of argument, say that half the working population is in the few very large companies and the other half is in many small and medium size companies. Oversimplifying a bit, this means that half of the working population are in companies able to manage risk and the other half are in companies that can’t.
What can be done to enhance the capability of that half that currently can’t manage information risk effectively (or at all)? What can we do to provide small and medium sized companies risk management tools that are pragmatic and implementable? We need techniques and mechanisms and to share learned experiences in performing risk management in small and medium sized companies.
Do you work in a small to medium sized company? How do you address IT risk management? What other reasons do you see for lack of IT risk management in medium and small sized companies?

