With the onslaught of new IoT systems and devices as well as existing old school IoT-ish systems such as HVAC, we all know that this is risk that needs to be assessed and managed. However, some of it is so new that we don’t really know where to start. We don’t have a broadly understood language to discuss, categorize, and classify new IoT systems. There has to be at least some rough categorization if there is going to be any attempt to manage risk brought to our organizations by evolving and rapidly growing numbers of IoT systems and devices.
Whence it came — using provenance to create IoT risk buckets
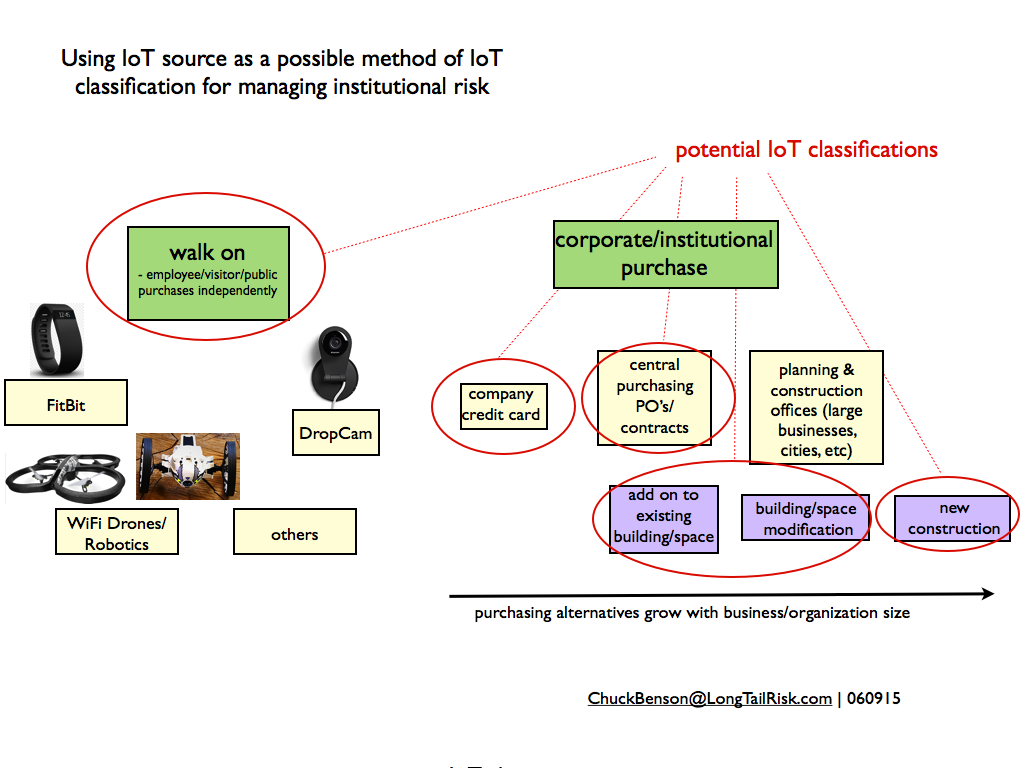
One approach to an initial categorization to IoT systems and devices can be to identify where those IoT systems are coming from. How do they show up in your offices, buildings, and corporate/institutional spaces? How did they get there?
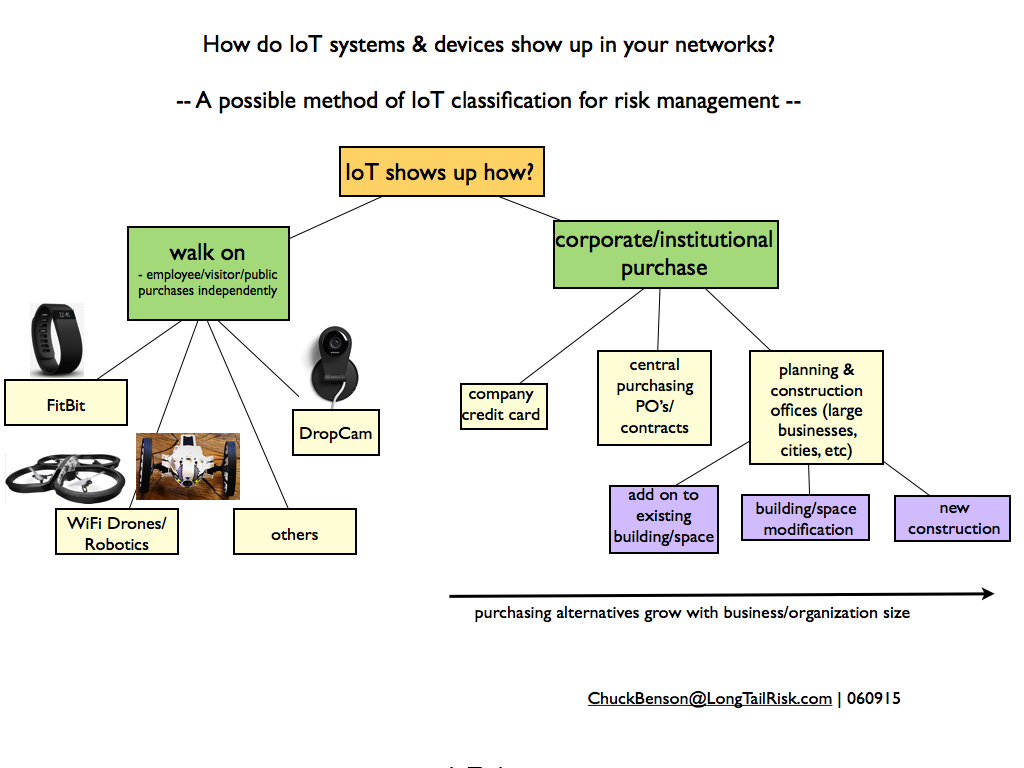
Some IoT just ‘walks on’ to corporate and institutional spaces while other IoT systems are purchased via different mechanisms
While trying to categorize IoT systems and devices by function, features, behavior, etc is a logical approach, it can be difficult to do in practice because so many new and varied IoT systems, devices, and applications are constantly showing up on our networks. Categorization and classification with this more traditional method can be a moving target, at least for now. Also, this approach can lead us down a rabbit hole looking for a perfect (and complex) taxonomy that would take a long time to develop, would likely be poorly understood, and probably largely not agreed upon. It reminds me of some older large websites that might have had perfect, library-like taxonomies but where 90% of the pages were never accessed. The website’s taxonomy might have been awesome, but no one cared. In fact, that perfect taxonomy might have actually diminished usability.
To begin the process of managing IoT risk now, we need some categorization now so that we have some buckets of risk to work with. This doesn’t mean that efforts to develop other classification schemes should be abandoned, but rather that categorizing IoT risk by source, aka the-way-it-got-here, is an approach that we can work with now.
Size matters
The manner in which businesses or institutions purchase IoT devices and systems typically varies with size of the organization. Smaller organizations will likely have fewer purchasing mechanisms than larger organizations. For example a small company might write a check or use a company credit card to purchase a simple IoT-based security system. Where as a larger organization might have a person or purchasing department that handles many purchases, uses purchase orders and invoicing, and probably has some purchasing policies and criteria and is used to purchase an HVAC system, for example. And yet an even bigger organization or government might have a central planning office that makes recommendations for new buildings or large scale building or community asset modifications. Larger organizations probably have all of these.
Regardless of how many purchasing options an organization has, using purchasing options to create categorized buckets of risk for IoT devices and systems could be a helpful way to go.
Walk-On-IoT — bring it, wear it, or fly it to work
One thing that all organizations have in common is that they all have “walk-on-IoT”. By the walk-on-IoT category, I mean IoT systems purchased or acquired by an individual on their own and that they then bring to work. Whether it is FitBit devices, drones, robotics, consumer networked video cameras, or others, these are devices that a person can purchase at BestBuy, Target, Amazon, or even their local drugstore and bring directly to their corporate or institutional work place.
Other potential source-based IoT risk categories
Some other potential source-based IoT risk categorizations might be:
- IoT devices/systems purchased with a company credit card
- IoT devices/systems purchased via a company’s central purchasing/contracting group
- IoT devices/systems recommended in the course of planning for major building modifications or new buildings (eg, in the case of large businesses and cities)
Identifying where an IoT system or device came from as a basis for initial IoT risk categorization
With these categories, we can start to ask some high level risk questions within each category. For example, is it even possible to feasibly manage this risk? If this risk is unmitigated, what is the impact? For example, can I really manage FitBit devices that walk on to my network? Probably not easily. More importantly, do I really care if FitBit users use their devices on my networks? Maybe not.
Conversely, because of privacy issues and other concerns, I might indeed care about how an enterprise-wide biometric building access system is selected, installed, commissioned, and supported over its lifetime. Furthermore, this risk probably is manageable with thoughtful institutional safeguards.
Source-based categories can lend themselves to unique risk mitigation approaches
Finally, sourced-based IoT risk categorization can also provide some natural mitigation approaches. For example, purchases via central purchasing can provide the opportunity to see a purchase request (prior to actual purchase) and then provide guidance on the selection of the IoT system, help identify resources for secure implementation, as well as help develop long term support plans for the IoT system. While less involved, IoT purchases via corporate credit card have records amenable for review so that an organization can get an estimation of number and variety of types of IoT devices and systems arriving in the enterprise. This can help with ongoing mitigation and support services planning.
Source-based categories for IoT system risk analysis and management for the enterprise can be a place to start. It is not the end-all by any stretch. As more IoT systems and devices enter our enterprises, we will learn more about their short and long term effects as well as emergent effects between IoT systems. From this we can continue to evolve categories and approaches, but if we need a place to start now, source-based risk categories are not a bad idea.