Monthly Archives: December 2014

Cerealboxing Shodan data

luckycharmsIn 2010, Steve Ocepek did a presentation at  DefCon where he introduced an idea that he called ‘cerealboxing’.  In it, he made a distinction between visibility and visualization. He suggested that visualization uses more of our ability to reason and visibility is more peripheral and taps into our human cognition.  He references Spivey and Dale in their paper Continuous Dynamics in Real-Time Cognition in saying:

“Real-time cognition is best described not as a sequence of logical operations performed on discrete symbols but as a continuously changing pattern of neuronal activity.”

Thinking on the back burner

Steve’s work involved building an Arduino-device that provides an indication of the source country of spawned web sessions while doing normal web browsing.  The idea was that as you do your typical browsing work, the device, via numbers and colors of illuminated LEDs would give an indication of how many web sessions were spawned on any particular page and where those sessions sourced from.  I built the device myself, ran it, and it was enlightening (no pun intended).

Using Steve’s device, while focused on something else — my web browsing, I had an indication out of the corner of my eye that I processed somewhat separately from my core task of browsing.  Without even trying or ‘thinking’, I was aware when a page lit up with many LED’s and many colors (indicating many sessions from many different countries).  I also became aware when I was seeing many web pages, regardless of my activity, that came from Brazil, for example.

Cerealbox

Steve named this secondary activity ‘cerealboxing’ as when you mindlessly read a cereal box at breakfast.  From one of his presentation slides:

  • Name came from our tendency to read/interpret anything in front of us
  • Kind of a “background” technology, something that we see peripherally
  • Pattern detection lets us see variances without digging too deep
  • Just enough info to let us know when it’s time to dig deeper

Back to excavating Shodan data

As I mentioned in my last post, Shodan data offers a great way to characterize some of the risk on your networks.  The challenge is that there is a lot of data.

One of the things that I want to know is what kinds of devices are showing up on my networks? What are some indicators? What words from ‘banner grabs’ indicate web cams, Industrial Control Systems, research systems, environmental control systems, biometrics systems, and others on my networks?  I started with millions of tokens.  How could I possibly find out interesting or relevant ‘tokens’ or key words in all of these?

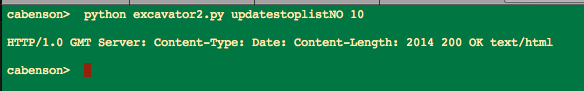
To approach this, I borrowed the cerealboxing idea and wrote a script that continuously displays this data on a window (or two) on my computer. And then just let it run while I’m doing other things. It may sound odd, but I found myself occasionally glancing over and catching an interesting word or token that I probably would not have seen otherwise.

cerealboxunordered

unordered tokens

So, in a nutshell, I approached it this way:

  • tokenize all of the banners in the study
  • I studied banners from my organization as well as peer organizations
  • do some token reduction with stoplists & regular expressions, eg 1 & 2 character tokens, known printers, frequent network banner tokens like ‘HTTP’, days of the week, months, info on SSH variants, control characters that made the output look weird, etc
  • scroll a running list of these in the background or on a separate machine/screen

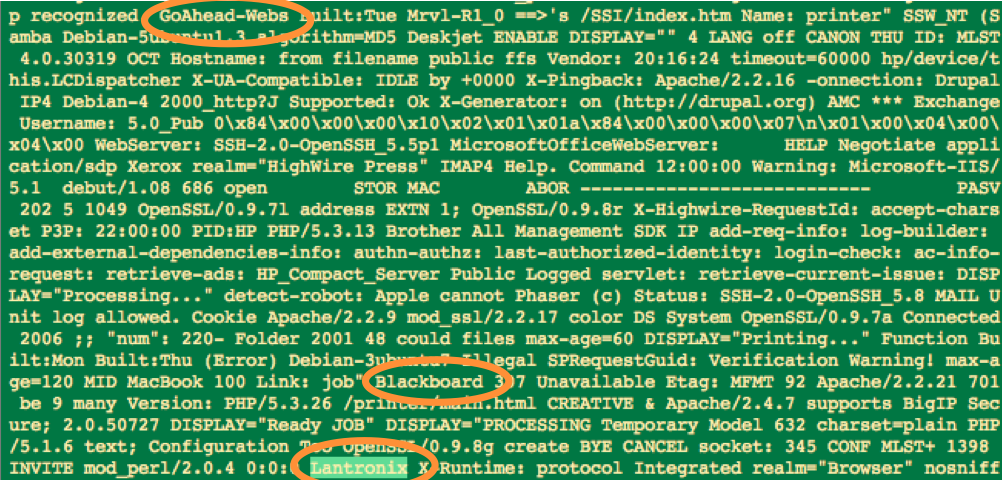
I also experimented with sorting by length of the tokens to see if that was more readable:

ordered5char

sorted by order — this section showing tokens (words) of 5 characters in length

In the course of doing this, I update a list of related tokens.  For example, some tokens related to networked cameras:

partiallist_networkcamera

And some related to audio and videoconferencing:

partiallist_telecom_videoconf

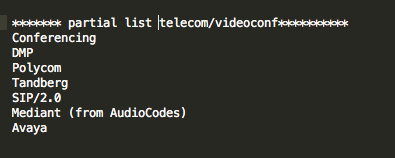
This evolving list of tokens will help me identify related device and system types on my networks as I periodically update the sample.

This is a fair amount of work to get this data, but once the process is identified and scripts written, it’s not so bad. Besides, with over 50 billion networked computing devices online in the next five years, what are you gonna do?

Excavating Shodan Data

excavator

A shovel at a time

The Shodan data source can be a good way to begin to profile your organization’s exposure created by Industrial Control Systems (ICS) and Internet of Things (IoT) devices and systems. Public IP addresses have already been scanned for responses to known ports and services and those responses have been stored in a searchable web accessible database — no muss, no fuss. The challenge is that there is A LOT of data to go through and determining what’s useful and what’s not useful is nontrivial.

Data returned from Shodan queries are results from ‘banner grabs’ from systems and devices. ‘Banner grabs’ are responses from devices and systems that are usually in place to assist with installing and managing the device/system. Fortunately or unfortunately, these banners can contain a lot of information. These banners can be helpful for tech support, users, and operators for managing devices and systems. However, that same banner data that devices and systems reveal about themselves to good guys is also revealed to bad guys.

What are we looking for?

So what data are we looking for? What would be helpful in determining some of my exposure? There are some obvious things that I might want to know about my organization. For example, are there web cams reporting themselves on my organization’s public address space? Are there rogue routers with known vulnerabilities installed? Industrial control or ‘SCADA’ systems advertising themselves? Systems advertising file, data, or control access?

The Shodan site itself provides easy starting points for these by listing and ranking popular search terms in it’s Explore page. (Again, this data is available to both good guys and bad guys). However, there are so many new products and systems and associated protocols for Industrial Control Systems and Internet of Things that we don’t know what they all are. In fact, they are so numerous and growing that we can’t know what they all are.

So how do we know what to look for in the Shodan data about our own spaces?

Excavation

My initial approach to this problem is to do what I call excavating Shodan data. I aggregate as much of the Shodan data as I can about my organization’s public address space. Importantly, I also research the data of peer organizations and include that in the aggregate as well. The reason for this is that there probably are some devices and systems that show up in peer organizations that will eventually also show up in mine.

Next, using some techniques from online document search, I tokenize all of the banners. That is, I chop up all of the words or strings into single words or ‘tokens.’ This results in hundreds of thousands of tokens for my current data set (roughly 1.5 million tokens). The next step is to compute the frequency of each, then sort in descending order, and finally display some number of those discovered words/tokens. For example, I might say show me the 10 most frequently occurring tokens in my data set:

devices1st10

Top 10 most frequently occurring words/tokens — no big surprises — lots of web stuff

I’ll eyeball those and then write those to a stoplist so that they don’t occur in the next run. Then I’ll look at the next 10 most frequently occurring. After doing that a few times, I’ll dig deeper, taking bigger chunks, and ask for the 100 most frequently occurring. And then maybe the next 1000 most frequently occurring.

This is the excavation part, gradually skimming the most frequently occurring off the top to see what’s ‘underneath’. Some of the results are surprising.

‘Password’ frequency in top 0.02% of banner words

Just glancing at the top 10, not much is surprising — a lot of web header stuff. Taking a look at the top 100 most frequently occurring banner tokens, we see more web stuff, NetBIOS revealing itself, some days of the week and months, and other. We also see our first example of third party web interface software with Virata-EmWeb. (Third party web interface software is interesting because a vulnerability here can cross into multiple different types of devices and systems.) Slicing off another layer and going deeper by 100, we find the token ‘Password’ at approximately the 250th most frequently occurring point. Since I’m going through 1.5 million words (tokens), that means that ‘Password’ frequency is in the top 0.02% or so of all tokens. That’s sort of interesting.

But as I dig deeper, say the top 1500 or so, I start to see Lantronix, a networked device controller, showing up. I see another third party web interface, GoAhead-Webs. Blackboard often indicates Point-of-Sale devices such as card swipers on vending machines. So even looking at only the top 0.1% of the tokens, some interesting things are showing up.

LantronixGoAheadBB

Digging deeper — Even in the top 0.1% of tokens, interesting things start to show up

New devices & systems showing up

But what about the newer, less frequently occurring, banner words (tokens) showing up in the list? Excavating like this can clearly get tedious, so what’s another approach for discovery of interesting, diagnostic, maybe slightly alarming words in banners on our networks? In a subsequent post, I’ll explain my next approach that I’ve named ‘cerealboxing’, based on an observation and concept of Steve Ocepek’s regarding our human tendency to automatically read, analyze, and/or ingest information in our environment, even if passively.