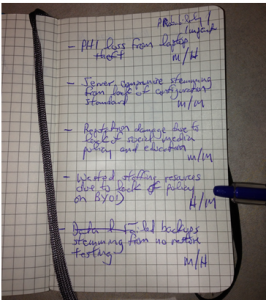
Starting an IT risk management program in the traditional sense appears daunting, and usually is, to a small or medium-sized business. This is one of the reasons that they often don’t get started. To make the insurmountable surmountable, start a simple risk register. If you haven’t already, start one today. Napkins, yellow legal pads, Moleskine notebooks, Evernote notes, etc all work to start.
Starting and developing a risk register will:
- increase your situational awareness of your environment
- serve as the basis of a communication tool to others
- demonstrate some intent and effort towards due care to auditors and regulators
- provide the basis of future more in depth analysis (as resources allow)
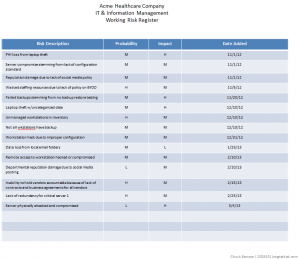
The simplest risk register will have three columns — a simple risk description, a likelihood of the event happening, and the impact of it happening. (Adding a fourth column that contains the date of when you added the risk can be helpful, but is not required).
Start with writing down the risks as soon as you think of them. If you haven’t done this before, several will probably pop into your head right off. The act of writing something down is deceptively powerful. It makes you articulate the problem and maybe revisit a couple of your assumptions about the problem. That said, don’t go nuts analyzing any particular risk when you start. Just get the core idea down, maybe something like, “PII loss resulting from laptop theft” or “reduced support effectiveness because of lack of BYOD policy.”
After you’ve got a dozen or so, take a break for now (you’ll add more later), and review the whole list. Make two columns next to this list. Label one column ‘probability’ and the other column ‘impact’. Next to each risk, write down what you think the likelihood of that event occurring — just High, Medium, or Low. Nothing fancier than that. Same thing with impact — how bad would it be if this event occurred? What’s the impact? Again, just High Medium or Low.
When you have a few minutes, you can structure this a little bit more by putting this in a table. I like using Powerpoint or Keynote over Excel/Numbers for this stage. By using Powerpoint’s cartoonish and colorful tables, I tend to stay oriented to the fact that I’ll be communicating these risks (or some of these risks) later on. If I use Excel for this, I tend to get overly analytical and detailed. It starts to become more of a math problem vs something that I will be communicating to others.
Keep in mind, that it is very easy to over-design beyond the point that is useful to you right now. And you want it to be useful to you right now. At this point, you are creating a simple document that informs you in that brief moment of time that have to look at it. You don’t want a document that taxes you right now. It needs to give you a quick easily digestible and broad view of your risk picture. If the document gets too complicated or goes into too much detail, you increase the likelihood that you won’t pick it up again tomorrow or in a week or in a month.
In an upcoming post, we’ll create a simple visualization tool, called a heat map, that can be very helpful in providing a profile of your risk picture.
Do you currently use a risk register now? How did you create it? How do you maintain it?


