Tag Archives: shodan

Power laws & power plants – tackling IoT systems risk classification

Do aspects of Shodan data – data about Internet of Things (IoT) devices and systems – demonstrate ‘long tail’ qualities? Data showing these qualities sometimes also go by the name of having a ‘Zipf distribution‘, following a power law, or behaving according to the Pareto principle. If there is in fact a reoccurring relationship or curve that occurs across aspects of IoT data, that might offer some insights into how to categorize or classify aspects of IoT systems. For managing risk around IoT systems implementations, our current ability to classify and categorize these systems is sorely missing. Potentially, it could also offer predictive capabilities regarding elements of the Internet of Things phenomena.

To take an initial swing at it, I narrowed the question down to:

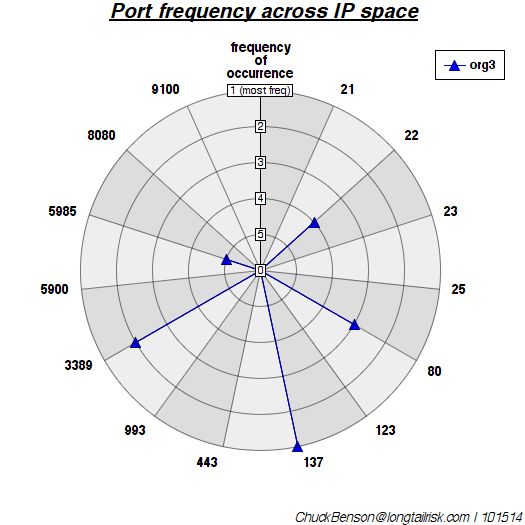
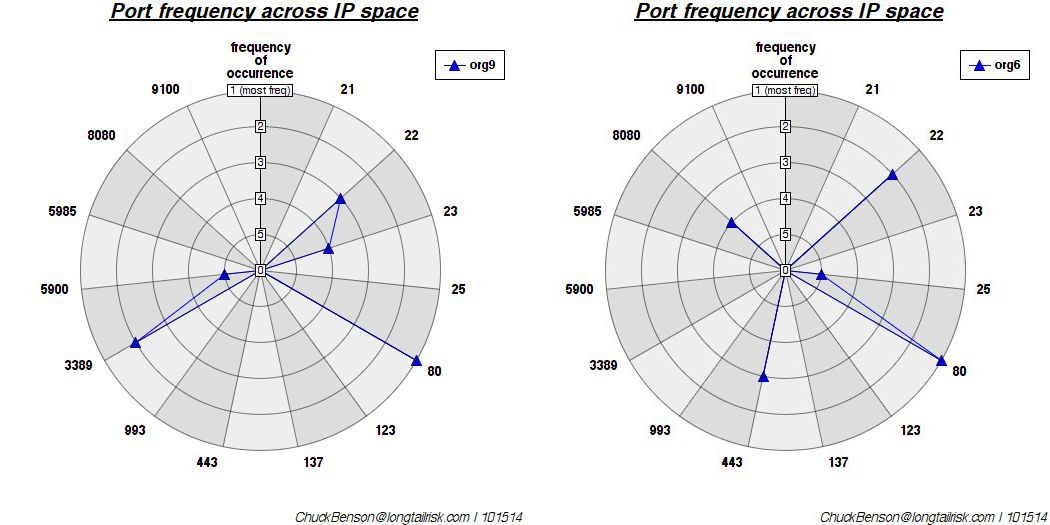
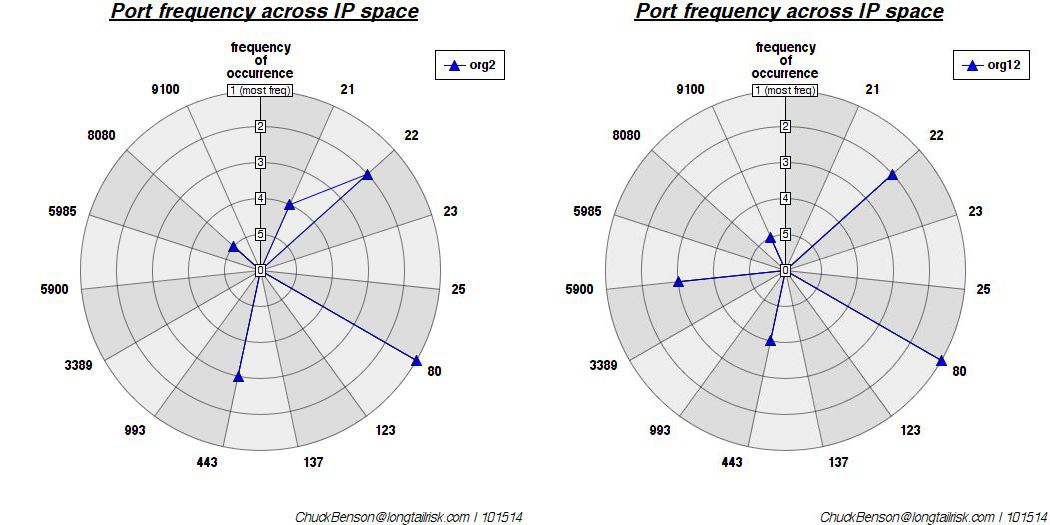
Do the frequencies of occurrences of particular ports (services) in an organization, or other Shodan data set, behave in a repeatable way?

Long tails & power laws

The concept of long tail behavior was popularized in Chris Anderson’s 2004 Wired article and it has entered popular vernacular in the years since. What Anderson articulated was that aspects of many systems or sets of data are characterized by the observation that there are a lot of a few types of things and then a rapidly dropping number of other types of things — but there are a lot of those other types. Anderson used the example of record sales — there are a relatively few mega-hit songs, but there are a lot of non-hit songs and record companies were learning how to capitalize on this observation. This is the long tail.

George Zipf

George Zipf

Another example is early ‘long tail’ work attributed to George Zipf with his analysis of word distribution frequencies in any particular text. He found that if you:

  1. counted how often each word appeared in a text
  2. ranked each word so that the word with the highest count got the highest rank (i.e. #1) and down from there
  3. plot the results in a graph

then you find a curve that shows that a few words show up a lot.


For example, the words ‘the’, ‘be’, and ‘to’ show up a lot (1st, 2nd, & 3rd in a ranked list) and words like ‘teeth’, ‘shell’, or ‘neck’ shows up around 1000 places down the list. From the first few spots in the ranked list, the frequencies of other ranked words fall off quickly — but there a lot of those ‘other’ words. Further, this curve is a power law which looks a bit like y = 1/x. Variations include multiplying 1/x by something and raising x to some exponent. (For Zipf relationships, this exponent is often close to 1).

Yet other Zipf relationships are found in studies of populations of cities data and website references.

citypopulationdata

Ranking city population sizes also follows Zipf-like relationships (the loglog plot is fairly linear)

Power law relationships in IoT data?

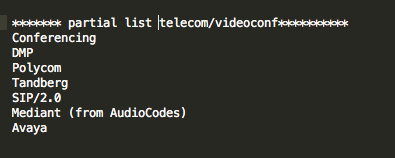
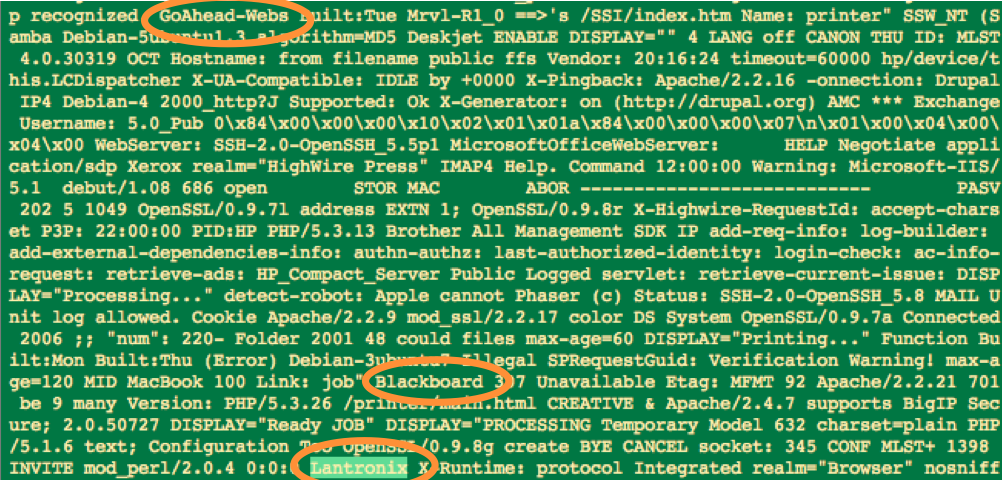
John Matherly, founder of Shodan, has been collecting data on IoT sorts of devices for years. He scans all publicly accessible IP addresses for particular ports for Internet of Things or Industrial Control systems including things like power plants, video cameras, HVAC systems, and others.

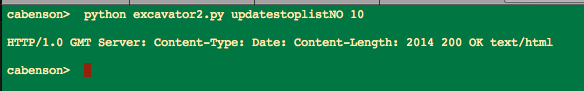
I have a particular interest in how IoT data shows in higher education IP address spaces, so I analyzed large subsets of data in some of those institutions. To do this I queried for data from those publicly facing IP spaces in the organization and exported it to a json format. (Shodan also offers an XML version, but it is deprecated). From the downloaded data, I used Python scripts to clean the data a bit, count how often each port occurred, and then rank them by organization. Finally, I used the Python module matplotlib to plot the results.

This is similar to the word frequency analysis approach above where, for a set of data:

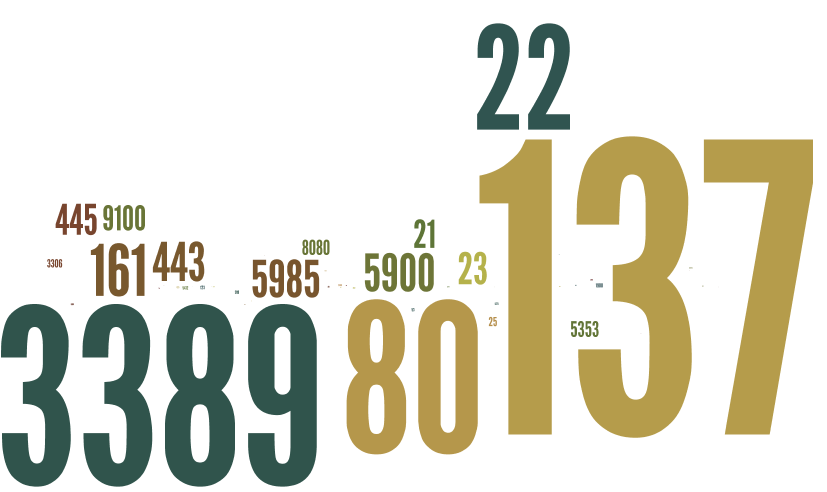
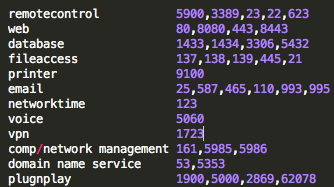
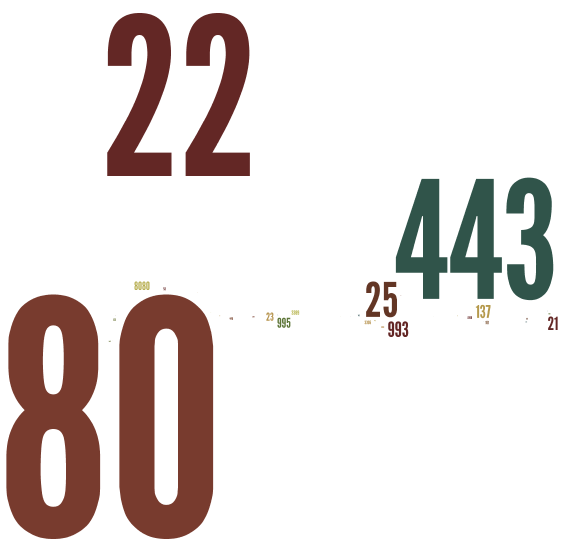
  1. Count the number of occurrences of each port (service)
  2. Rank the ports so that the port (service) that occurs most frequently gets the highest rank
  3. Plot the results

Like word frequency data in Zipf studies, a plot of frequency of occurrence of each port vs rank of each port’s frequency yields a curve that drops off so fast that it is hard to discern nuanced information. However, the fact that it does drop off so fast let’s us know something at a glance that is similar to Zipf data — a very few ports occur most often and a lot of ports have a few occurrences.

nonlogmultipleuniversity

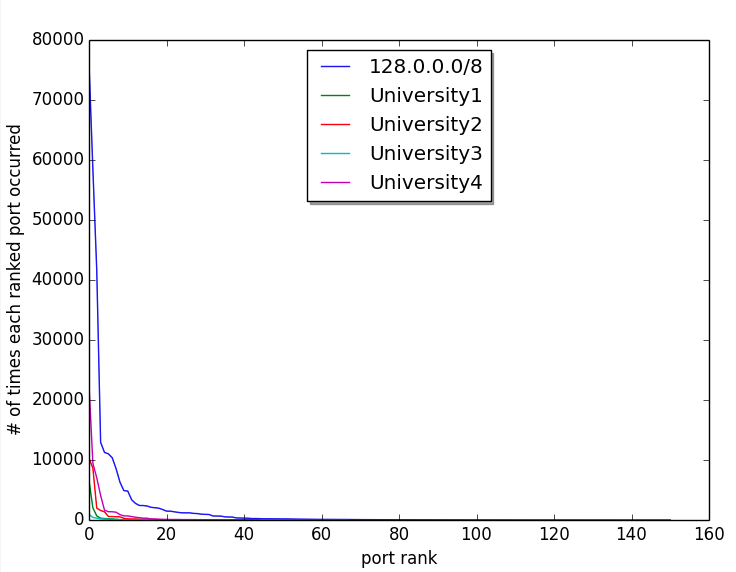
4 universities and 1 (organizationally) arbitrary & large) set of IP addresses on normal (non-log) plot

What gets more interesting visually is to plot that same data on a log log scale. This kind of brings the curve out to where it’s easier to see.

Zipf-like data can follow the relationship of y = 1/x almost exactly for much of the range. (This is part of why word frequency, city population data, etc is so intriguing.) So when plotted on log log, much of the line looks almost straight – slope of 1 (ish).

A log log plot of university IoT data doesn’t yield a straight line, but sort of a bulging out line. If you were standing on the graph way out to the right and up and looking toward the origin, it would appear convex. So this isn’t Zipf in the traditional sense — the log log plot is not linear.

However, they do look similar. University1 looks roughly like University2. University2 like University3, and University3 like University4, etc. The curve roughly retains its shape regardless of the school, though the school sizes are different (or at least the number of public IP addresses are different).

loglogmultipleuniversity

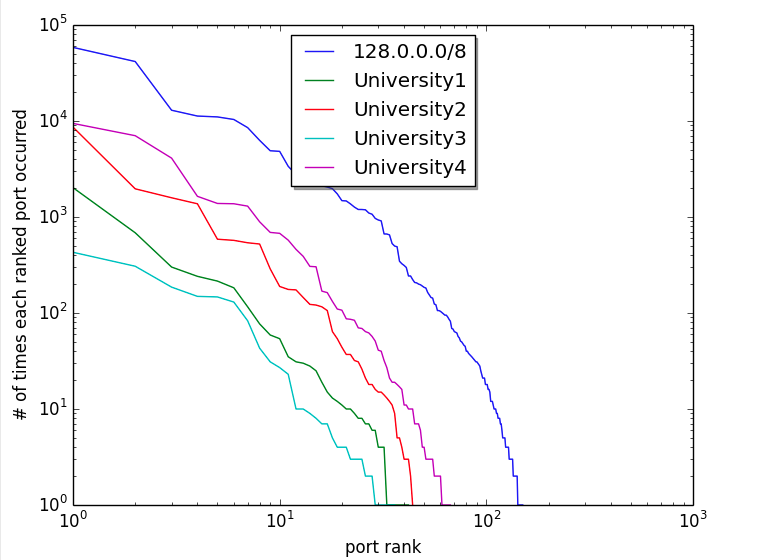
4 universities and 1 (organizationally) arbitrary & large set of IP addresses on log log plot

Maybe the organization doesn’t matter?

Also plotted are the results from a search on all of the IP addresses in the 128.0.0.0/8 range (using CIDR notation).  This curve, though bigger and slightly smoother, has roughly the same shape as the others. The main thing that separates it from the others appears to be magnitude (number of IP addresses sampled). It appears that there is nothing particularly unique about an organization that drives this curve shape — a similar shape appears even if a set based on a numerical range, regardless of organization, is chosen.

It will be interesting to see if, as IoT device count grows, the curve changes shape. Will the set of IoT devices across the globe continue to communicate mostly over the same ports/services as those currently in use, keeping the same shape? Or will new ports/services/enumerations show themselves as IoT device proliferation continues, changing the shape?  By analyzing ranking relationships over time and between organizations, this approach could provide some insight into helpful categorizations for risk analysis.

Institutional considerations for managing risk around IoT

socket

sockets for vendor products & services

There are a number of things to think about when planning and deploying an IoT system in your institution. In posts here since last spring, several issues have been touched upon — the idea of sockets and seams in vendor relationships, the rapid growth in vendor relationships to be managed and the resulting costs to your organization, communicating IoT risk, some quick risk visualization techniques based on Shodan data, initial categorization of IoT systems, and others.  The FBI warning on IoT last week is a further reminder of what we’re up against.

There is a lot to chew on and digest in this rapidly changing IoT ecosystem. Below is a partial list of some things to consider when planning and deploying IoT systems and devices in your institution. It’s not a checklist where all work is done when the checking is complete. Rather, it is intended to be a starting list of potential talking points that you can have with your team and your potential IoT vendors.

Some IoT Planning Considerations

  • Does IoT vendor need 1 (or more) data feeds/data sharing from your organization?
    • Are the data feeds well-defined?
    • Do they exist already?
    • If not, who will create & support them?
    • Are there privacy considerations?
  • How many endpoint devices will be installed?
    • Is there a patch plan?
    • Do you do the patching?
    • Who manages the plan, you or the vendor?
  • Does this vendor’s system have dependencies on other systems?
  • How many IoT systems are you already managing?
    • How many endpoints do you already have?
    • Are you anticipating/planning or planning more in the next 18 months?
  • Is there a commissioning plan? Or have IoT vendor deliverable expectations otherwise been stated (contract, memorandum of understanding, letter, other?)
    • Has the vendor changed default logins and passwords? Has the password schema been shared with you?
    • Are non-required ports closed on all your deployed IoT endpoints?
    • Has the vendor port scanned (or similar) all deployed IoT endpoints after installation?
    • Is there a plan (for you or vendor) to periodically spot check configuration of endpoint devices?
  • Has the installed system been documented?
    • Is there (at least) a simple architecture diagram?
      • Server configuration documented?
      • Endpoint IP addresses & ports indicated?
  • Who pays for the vendor’s system requirements (eg hardware, supporting software, networking, etc?)
    • Does local support (staffing/FTE) exist to support the installation? Is it available? Will it remain available?
    • If supporting IoT servers are hosted in a data center, who pays those costs?
      • startup & ongoing costs?
    • Same for cloud — if hosted in cloud, who pays those costs?
      • startup & ongoing costs?
  • What is total operational cost after installation?
    • licensing costs
    • support contract costs
    • hosting requirements costs
    • business resiliency requirements costs
      • eg redundancy, recovery, etc for OS, databases, apps
  • How can the vendor demonstrate contract performance?
    • Okay to ask vendor to help you figure this out
  • Who in your organization will manage the vendor contract for vendor performance?
    • Without person/team to do this, the contract won’t get managed
  • Can vendor maintenance contract offset local IT support shortages?
    • If not, then this might not be the deal you want
  • For remote support, how does vendor safeguard login & account information?
    • Do they have a company policy or Standard Operating Procedure that they can share with you?
  • Is a risk sharing agreement in place between you and the vendor?
    • Who is liable for what?

Typically, with the resources at hand, it will be difficult to get through all of these — maybe even some of these. The important thing, though, is to get through what we can and then be aware of and acknowledge the ones we weren’t able to do. It’s way better to know we’ve come up short given limited resources than to think we’ve covered everything when we’re not even in the ballpark.

Attacks on internet of things top security predictions for 2015

iotattacks

Attacks on Internet of Things tops list of Symantec’s 2015 Security Predictions. The post and infographic say that there will be a particular focus on smart home automation. Interestingly, the blog post references what is likely the Shodan database, referring to it as a “search engine that allows people to do an online search for Internet-enabled devices,” but does not mention it by name. While attacks on IoT devices/systems or attacks via IoT devices/systems is certainly not the only risk, it is further evidence that the attack surface provided by the rapid growth of IoT/ICS devices and systems is a burgeoning risk sector.

The report also highlights attacks on mobile devices, continuing ransomware attacks, and DDOS attacks.

Cerealboxing Shodan data

luckycharmsIn 2010, Steve Ocepek did a presentation at  DefCon where he introduced an idea that he called ‘cerealboxing’.  In it, he made a distinction between visibility and visualization. He suggested that visualization uses more of our ability to reason and visibility is more peripheral and taps into our human cognition.  He references Spivey and Dale in their paper Continuous Dynamics in Real-Time Cognition in saying:

“Real-time cognition is best described not as a sequence of logical operations performed on discrete symbols but as a continuously changing pattern of neuronal activity.”

Thinking on the back burner

Steve’s work involved building an Arduino-device that provides an indication of the source country of spawned web sessions while doing normal web browsing.  The idea was that as you do your typical browsing work, the device, via numbers and colors of illuminated LEDs would give an indication of how many web sessions were spawned on any particular page and where those sessions sourced from.  I built the device myself, ran it, and it was enlightening (no pun intended).

Using Steve’s device, while focused on something else — my web browsing, I had an indication out of the corner of my eye that I processed somewhat separately from my core task of browsing.  Without even trying or ‘thinking’, I was aware when a page lit up with many LED’s and many colors (indicating many sessions from many different countries).  I also became aware when I was seeing many web pages, regardless of my activity, that came from Brazil, for example.

Cerealbox

Steve named this secondary activity ‘cerealboxing’ as when you mindlessly read a cereal box at breakfast.  From one of his presentation slides:

  • Name came from our tendency to read/interpret anything in front of us
  • Kind of a “background” technology, something that we see peripherally
  • Pattern detection lets us see variances without digging too deep
  • Just enough info to let us know when it’s time to dig deeper

Back to excavating Shodan data

As I mentioned in my last post, Shodan data offers a great way to characterize some of the risk on your networks.  The challenge is that there is a lot of data.

One of the things that I want to know is what kinds of devices are showing up on my networks? What are some indicators? What words from ‘banner grabs’ indicate web cams, Industrial Control Systems, research systems, environmental control systems, biometrics systems, and others on my networks?  I started with millions of tokens.  How could I possibly find out interesting or relevant ‘tokens’ or key words in all of these?

To approach this, I borrowed the cerealboxing idea and wrote a script that continuously displays this data on a window (or two) on my computer. And then just let it run while I’m doing other things. It may sound odd, but I found myself occasionally glancing over and catching an interesting word or token that I probably would not have seen otherwise.

cerealboxunordered

unordered tokens

So, in a nutshell, I approached it this way:

  • tokenize all of the banners in the study
  • I studied banners from my organization as well as peer organizations
  • do some token reduction with stoplists & regular expressions, eg 1 & 2 character tokens, known printers, frequent network banner tokens like ‘HTTP’, days of the week, months, info on SSH variants, control characters that made the output look weird, etc
  • scroll a running list of these in the background or on a separate machine/screen

I also experimented with sorting by length of the tokens to see if that was more readable:

ordered5char

sorted by order — this section showing tokens (words) of 5 characters in length

In the course of doing this, I update a list of related tokens.  For example, some tokens related to networked cameras:

partiallist_networkcamera

And some related to audio and videoconferencing:

partiallist_telecom_videoconf

This evolving list of tokens will help me identify related device and system types on my networks as I periodically update the sample.

This is a fair amount of work to get this data, but once the process is identified and scripts written, it’s not so bad. Besides, with over 50 billion networked computing devices online in the next five years, what are you gonna do?

Excavating Shodan Data

excavator

A shovel at a time

The Shodan data source can be a good way to begin to profile your organization’s exposure created by Industrial Control Systems (ICS) and Internet of Things (IoT) devices and systems. Public IP addresses have already been scanned for responses to known ports and services and those responses have been stored in a searchable web accessible database — no muss, no fuss. The challenge is that there is A LOT of data to go through and determining what’s useful and what’s not useful is nontrivial.

Data returned from Shodan queries are results from ‘banner grabs’ from systems and devices. ‘Banner grabs’ are responses from devices and systems that are usually in place to assist with installing and managing the device/system. Fortunately or unfortunately, these banners can contain a lot of information. These banners can be helpful for tech support, users, and operators for managing devices and systems. However, that same banner data that devices and systems reveal about themselves to good guys is also revealed to bad guys.

What are we looking for?

So what data are we looking for? What would be helpful in determining some of my exposure? There are some obvious things that I might want to know about my organization. For example, are there web cams reporting themselves on my organization’s public address space? Are there rogue routers with known vulnerabilities installed? Industrial control or ‘SCADA’ systems advertising themselves? Systems advertising file, data, or control access?

The Shodan site itself provides easy starting points for these by listing and ranking popular search terms in it’s Explore page. (Again, this data is available to both good guys and bad guys). However, there are so many new products and systems and associated protocols for Industrial Control Systems and Internet of Things that we don’t know what they all are. In fact, they are so numerous and growing that we can’t know what they all are.

So how do we know what to look for in the Shodan data about our own spaces?

Excavation

My initial approach to this problem is to do what I call excavating Shodan data. I aggregate as much of the Shodan data as I can about my organization’s public address space. Importantly, I also research the data of peer organizations and include that in the aggregate as well. The reason for this is that there probably are some devices and systems that show up in peer organizations that will eventually also show up in mine.

Next, using some techniques from online document search, I tokenize all of the banners. That is, I chop up all of the words or strings into single words or ‘tokens.’ This results in hundreds of thousands of tokens for my current data set (roughly 1.5 million tokens). The next step is to compute the frequency of each, then sort in descending order, and finally display some number of those discovered words/tokens. For example, I might say show me the 10 most frequently occurring tokens in my data set:

devices1st10

Top 10 most frequently occurring words/tokens — no big surprises — lots of web stuff

I’ll eyeball those and then write those to a stoplist so that they don’t occur in the next run. Then I’ll look at the next 10 most frequently occurring. After doing that a few times, I’ll dig deeper, taking bigger chunks, and ask for the 100 most frequently occurring. And then maybe the next 1000 most frequently occurring.

This is the excavation part, gradually skimming the most frequently occurring off the top to see what’s ‘underneath’. Some of the results are surprising.

‘Password’ frequency in top 0.02% of banner words

Just glancing at the top 10, not much is surprising — a lot of web header stuff. Taking a look at the top 100 most frequently occurring banner tokens, we see more web stuff, NetBIOS revealing itself, some days of the week and months, and other. We also see our first example of third party web interface software with Virata-EmWeb. (Third party web interface software is interesting because a vulnerability here can cross into multiple different types of devices and systems.) Slicing off another layer and going deeper by 100, we find the token ‘Password’ at approximately the 250th most frequently occurring point. Since I’m going through 1.5 million words (tokens), that means that ‘Password’ frequency is in the top 0.02% or so of all tokens. That’s sort of interesting.

But as I dig deeper, say the top 1500 or so, I start to see Lantronix, a networked device controller, showing up. I see another third party web interface, GoAhead-Webs. Blackboard often indicates Point-of-Sale devices such as card swipers on vending machines. So even looking at only the top 0.1% of the tokens, some interesting things are showing up.

LantronixGoAheadBB

Digging deeper — Even in the top 0.1% of tokens, interesting things start to show up

New devices & systems showing up

But what about the newer, less frequently occurring, banner words (tokens) showing up in the list? Excavating like this can clearly get tedious, so what’s another approach for discovery of interesting, diagnostic, maybe slightly alarming words in banners on our networks? In a subsequent post, I’ll explain my next approach that I’ve named ‘cerealboxing’, based on an observation and concept of Steve Ocepek’s regarding our human tendency to automatically read, analyze, and/or ingest information in our environment, even if passively.

Poor Man’s Risk Visualization II

Categorizing and clumping (aggregating) simple exposure data from the Shodan database can help communicate some risks that otherwise might have been missed.  Even with the loss of some accuracy (or maybe because of loss of accuracy), grouping some data into larger buckets can help communicate risk/exposure. For example, a couple of posts ago in Poor Man’s Industrial Control System Visualization, Shodan data was used to do a quick visual analysis of what ports and services are open on publicly available IP addresses for different organizations. Wordle was used to generate word clouds and show relative frequency of occurrence where ‘words’ where actually port/service numbers.

Trading-off some accuracy for comprehension

This is great for yourself or colleagues that are also fairly familiar with port numbers, the services that they represent, and what their relative frequencies might imply. However, often we’re trying to communicate these ideas to business people and/or senior management. Raw port numbers aren’t going to mean much to them. A way to address this is to pre-categorize the port numbers/services so that some of them clump together.

Yes, there is a loss of some accuracy with this approach — whenever we generalize or categorize, there is a loss of information.  However, when the domain-specific information makes it difficult or impossible to communicate to another that does not work in that domain (with some interesting parallels to the notion of channel capacity), it’s worth the accuracy loss so that something useful gets communicated. Similar to the earlier post of port/service numbers only, one organization has this ‘port number cloud’:

org1portnum

A fair amount of helpful quick-glance detail consumable by the IT or security professional, but not much help to the non-IT professional

Again, this might have some utility to an IT or security professional, but not much to anyone else. However, by aggregating some of the ports returned into categories and using descriptive words instead, something more understandable by business colleagues and/or management can be rendered:

org1word

For communicating risk/exposure, this is a little more readable & understandable to a broader audience, especially business colleagues & senior management

How you categorize is up to you. I’ll list my criteria below for these examples. It’s important not to get too caught up in the nuance of the categorization. There are a million ways to categorize and many ports/services serve a combination of functions. You get to make the cut on these categories to best illustrate the message that you are trying to get across. As long as you can show how you went about it, then you’re okay.

portcat

One way to categorize ports — choose a method that best helps you communicate your situation

The port number and ‘categorized’ clouds for a smaller organization with less variety are below.


org2portnum

A port number ‘cloud’ for a different (and smaller) organization with less variety in port/service types

org2word

The same port/service categorization as used above, but for the smaller organization, yields a very different looking word cloud

One challenge with the more clear approach is that your business colleagues or senior management might leap to a conclusion that you don’t want them too. For example, you will need to be prepared for the course of action that you have in mind. You might need to explain, for example, that though there are many web servers in your organization, your bigger concern might be exposure of telnet and ftp access, default passwords, or all of the above.

This descriptive language categorization approach can be a useful way to demonstrate port/service exposure in your organization, but it does not obviate the need for a mitigation plan.

Borrowing from search to characterize network risk

Most frequently occurring port is in outer ring, 2nd most is next ring in, ...

Most frequently occurring port is in outer ring, 2nd most is next ring in, …

Borrowing some ideas from document search techniques, data from the Shodan database can be used to characterize networks at a glance. In the last post, I used Shodan data for public IP spaces associated with different organizations and Wordle to create a quick and dirty word cloud visualization of exposure by port/service for that organization.

The word cloud idea works pretty well in communicating at a glance the top two or three ports/services most frequently seen for a given area of study (IP space).  I wanted to extend this a bit and compare organizations by a linear rank of the most frequently occurring services seen on that organization’s network.  So I wanted to capture both the most frequently occurring ports/services as well as the rank amongst those and then use those criteria to potentially compare different organizations (IP spaces).

Vector space model

I also wanted to experiment with visualizing this in a way that would give at a glance something of a ‘signature’.  Sooooo, here’s the idea: document search often uses this idea of a vector space model where documents are broken down into vectors.  The vector is a list of words representing all of the words that occur in that document.  The weight given to each word (or term or element) in the vector can be computed in a number of different ways, but one of the most popular is frequency with which that word occurs in that document (and sometimes with which it occurs in all of the documents combined).

A similar idea was used here, except that I used frequency with which ports/services appeared in an organization instead of words in a document. I looked at the top 5 ports/services that appeared.  I also experimented with the top 10 ports/services, but that got a little busy on the graphic and it also seemed that as I moved further down the ordered port list — 8th most frequent, 9th most frequent, etc — that these additional ports were adding less and less to the characterization of the network. Could be wrong, but it just seemed that way at the time.

I went through 12 organizations and collected the top 5 ports/services in each. Organizations varied between approximately 10,000 and 50,000 IP addresses. To have a basis for comparison of each organization, I used a list created by the ports returned from all of the organizations’ Top 5 ports.

Visualizing port rank ‘signatures’

A polar plot was created where each radial represents each port/service.  The rings of the plot represent the rank of that port — most frequently occurring, 2nd most frequently occurring, …, 5th most frequently occurring. I used a polar plot because I wanted something that might generate easily recognizable shapes or patterns. Another plot could have been used, but this one grabbed my eye the most.

Finally, to really get geeky, to measure similarity in some form, I computed the Euclidean distance between each possible vector pair. Two of the closest organizations of the 12 analyzed are (that is most similar port vectors):


mostsimilar

2 of the most similar organizations by Euclidean distance — ports 21, 23, & 443 show up with the same rank & port 80 shows up with a rank difference of only 1. This makes them close.  (Euclidean distance of ~2.5)

Two of the furthest way of the 12 studied are these (least similar port vectors):


leastsimilar

While port 80 aligns between the two (has the same rank) and port 22 is close in rank between the two, there is no alignment between ports 23, 3389, or 5900. This non-alignment, non-similar port rank, creates more distance between the two. (Euclidean distance of ~9.8)

Finally, this last one is some where in the middle (mean) of the pack:


midsimilar

A distance chosen from the middle of the sorted distance (mean). Euclidean distance is ~8.7. Because this median value is much closer to the most dissimilar, it seems to indicate a high degree of dissimilarity across the set studied (I think).

Overall, I liked the plots. I also liked the polar approach. I was hoping that I would see a little more of a ‘shape feel’, but I only studied 12 organizations.  I’d like to add more organizations to the study and see if additional patterns emerge. I also tried other distance measuring methods (Hamming, cosine, jaccard, Chebyshev, cityblock, etc) because they were readily available and easy to use with the scipy library that I was using, but none offered a noticeable uptick in utility over the plain Euclidean measure.

Cool questions from this to pursue might be:

1. For similar patterns between 2 or more organizations, can history of network development be inferred? Was a key person at both organizations at some point? Did one org copy another org?

2. Could the ranked port exposure lend itself to approximating risk for combined/multiprong cyber attack?

Again, if you’re doing similar work on network/IP space characterization and want to share, please contact me at ChuckBenson at this website’s domain for email.

Shodan creator opens up tools and services to higher ed

beecham_research_internet_of_things

Cisco/Beecham

The Shodan database and web site, famous for identifying and cataloging the Internet for Industrial Control Systems and Internet of Things devices and systems, is now providing free tools to educational institutions. Shodan creator John Matherly says that “by making the information about what is on their [universities] network more accessible they will start fixing/ discussing some of the systemic issues.”

The .edu package includes over 100 export credits (for large data/report exports), access to the new Shodan maps feature which correlates results with geographical maps, and the Small Business API plan which provides programmatic access to the data (vs web access or exports).

It has been acknowledged that higher ed faces unique and substantial risks due in part to intellectual property derived from research and Personally Identifiable Information (PII) issues surrounding students, faculty, and staff. In fact, a recent report states that US higher education institutions are at higher risk of security breach than retail or healthcare. The FBI has documented multiple attack avenues on universities in their white paper, Higher Education and National Security: The Targeting of Sensitive, Proprietary and Classified Information on Campuses of Higher Education .

The openness and sharing and knowledge propagation mindset of universities can be a significant component of the risk that they face.

Data breaches at universities have clear financial and reputation impacts to the organization. Reputation damage at universities not only affects the ability to attract students, it also likely affects the ability of universities to recruit and retain high producing, highly visible faculty.

This realm of risk of Industrial Control Systems combined with Internet of Things is a rapidly growing and little understood sector of exposure for universities. In addition to research data and intellectual property, PII data from students, faculty, and staff, and PHI data if the university has a medical facility, universities can also be like small to medium sized cities. These ‘cities’ might provide electric, gas, and water services, run their own HVAC systems, fire alarm systems, building access systems and other ICS/IoT kinds of systems. As in other organizations, these can provide substantial points of attack for malicious actors.

Use of tools such as Shodan to identify, analyze, prioritize, and develop mitigation plans are important for any higher education organization. Even if the resources are not immediately available to mitigate identified risk, at least university leadership knows it is there and has the opportunity to weigh that risk along with all of the other risks that universities face. We can rest assured that bad guys, whatever their respective motivations, are looking at exposure and attack avenues at higher education institutions — higher ed institutions might as well have the same information as the bad guys.

Vulnerability found in Netgear home and small business router

netgearrouterA significant vulnerability has been found in the latest version (WNDR3700v4) of Netgear’s N600 Wireless Dual-Band Gigabit Router.  Per the researcher with Tactical Network Solutions that discovered the flaw, it is “trivially exploitable” and allows the attacker to disable authentication, open up a backdoor (telnet session), and then return the router to its original state so that the user never knows it was open.  According to PC World, other routers may be affected as well.

To mitigate the risk:

  • get the latest patch from Netgear (the Shodan database still shows at least 600 unpatched routers with the WNDR3700v4 hardware revision)
  • disable remote administration of the router (always)
  • use strong WPA2 pass phrases
  • don’t allow strangers on your network