Author Archives: admin

Internet2 Chief Innovation Office launches IoT Systems Risk Management Task Force

Internet2 has launched a national Task Force to study risk management needs around IoT Systems in Higher Education and research institutions. The Task Force is composed of Higher Education and research IT and Information Management leaders across the country and will explore the areas of IoT Systems selection, procurement, implementation, and management. At the end of 12 months, the IoT Systems Risk Management Task Force will deliver a set of recommendations for 3 – 5 areas of further in-depth work. (And in the interest of full disclosure, I am Chairing the IoT Systems Risk Management Task Force.)

Internet of Things Systems or IoT Systems offer great potential value to higher education, research, government, and corporate institutions. From energy management, to research automation systems, to systems that enhance student, faculty, staff, and public safety, to academic learning systems, IoT Systems offer great promise. However, these systems need to be implemented thoughtfully and thoroughly or the investment value won’t be realized. Further, because of the distributed computing and networking capabilities of IoT devices, poor IoT Systems implementations can even make things worse for institutions, corporations, or governments.

Internet2 Chief Innovation Office

i2logoThe mission of the Internet 2 Chief Innovation Office, led by Florence Hudson,  is to work with Internet2 members to define and develop new innovations around the Internet. The Innovation Program has three core working groups —

Internet2’s core offerings are its 100 gbps network and their NET+ services.  Their membership includes 300 Higher Education institutions and over 150 industry, lab, and national agency organizations.

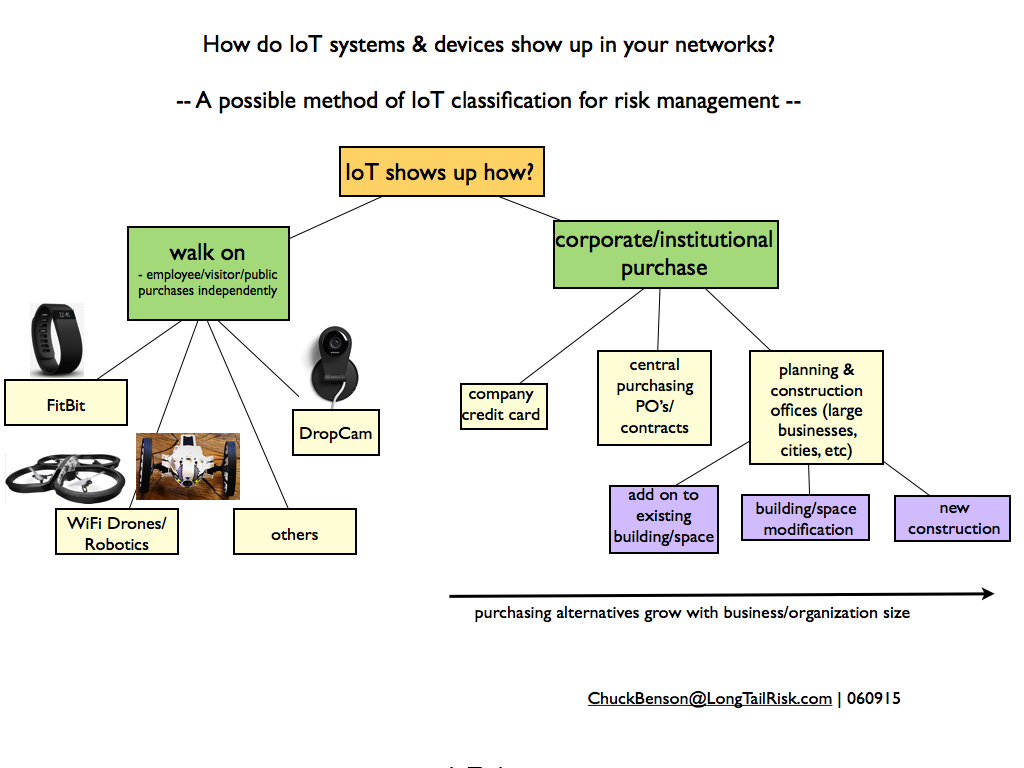
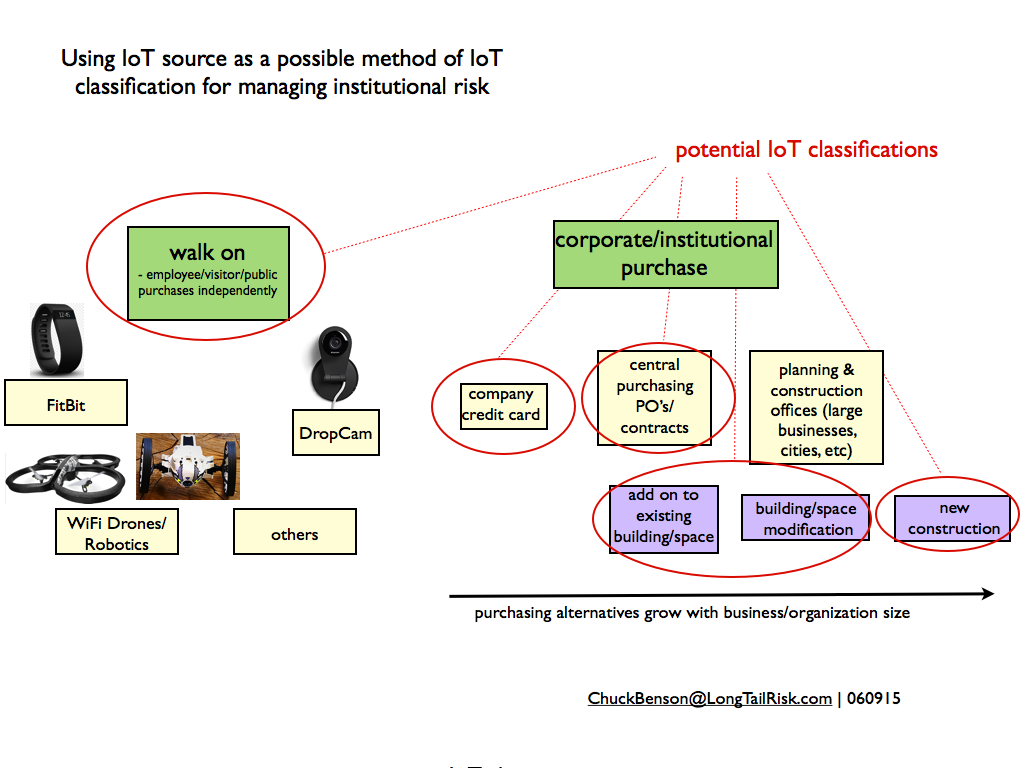
Many IoT systems risk topics

Examples of topics that the Task Force will cover include IoT systems vendor management issues, network segmentation strategies and approaches, cost estimating tools and approaches for IoT systems, potential tool development and/or partnering with organizations that perform Internet-wide scanning for IoT-related systems, and the organizational and cultural issues encountered in transitioning to a data-centric organization.

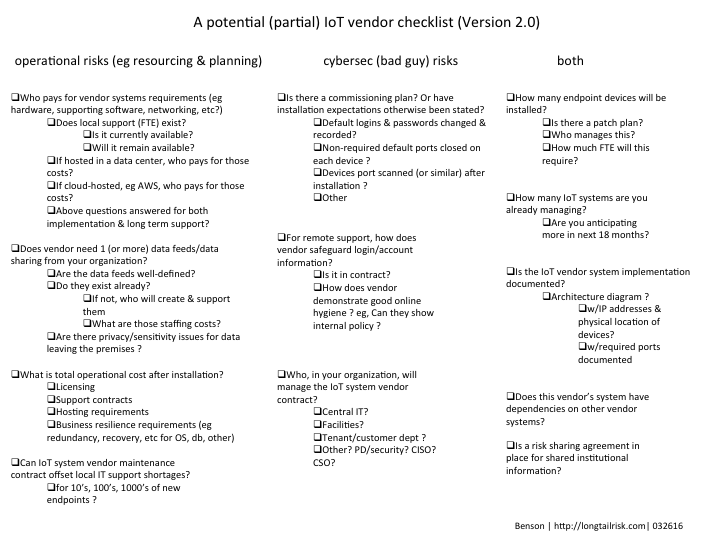
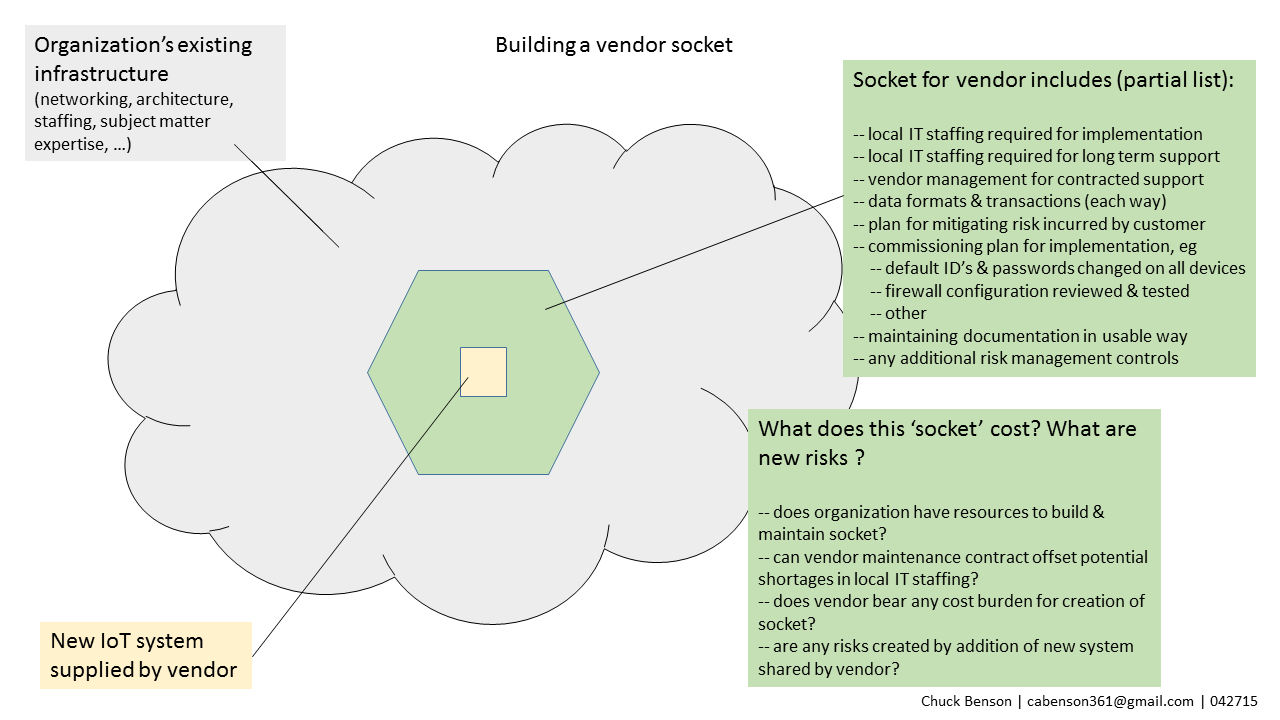
IoT systems vendor management approaches

Organizations and institutions need to raise the bar with IoT systems vendors regarding what constitutes a successfully delivered product or service. For example, has the vendor delivered documentation showing the final installation architecture, have default logins & passwords been change on all devices (how is this demonstrated), have all unnecessary services been deactivated on all devices and systems and how is this demonstrated?

Development of common ‘backends’ for IoT systems

Current IoT systems (to include utility distribution, building automation systems, many others) vendor approaches require that institutions invest in separate and proprietary ‘backend’ architectures consisting of application servers, databases, etc for each different vendor. This is an approach that does not lend itself to manageability, extensibility, or scalability.  In this space, perhaps newer container and container management technologies offer solutions as well as other possibilities.

1200px-Internet_of_things_wilgengebroedDevelopment of network segmentation/micro-segmentation strategies and approaches for IoT Systems

Network segmentation seems to offer great promise for mitigating risk around IoT Systems implementations. However, without appropriate guidance for IoT network segmentation implementation and operation, institutions can end up with a full portfolio of poorly managed network segments. Exploration and development of institutional network segmentation best practices can serve to lower an organization’s risk profile.

Development of cost estimating tools and approaches for IoT Systems

There is little in the way of precedent for cost models for the rapidly evolving IoT systems space and, as such, planning for IoT Systems and trying to estimate Total Cost of Ownership is difficult and nuanced. Exploration of and development of IoT Systems cost models can be of real value to institutions making planning and resourcing decisions.

Development of risk language & risk categories around IoT systems

Currently it is difficult to discuss new risk brought on by IoT systems with enterprise risk managers because IoT systems themselves are difficult to describe and discuss.  Development and socializing IoT risk language, that incorporates existing familiar institutional risk language, would enhance the ability to discuss IoT systems risk at the enterprise level. This Task Force will explore this nuanced space as well.

Analysis tool development and partnering

The Task Force will explore tool development and/or partnerships with organizations that scan the Internet for industrial control systems and IoT systems and publish these results online. Exploring internal tool development of the same is also a possibility. Development of benchmarks and baselines of Internet-scanning results across different industries and market sectors will also be considered.

Organizational cultural barriers to successful implementation of IoT Systems

Changing from a traditional organization to a data centric organization is a non-trivial transition and not addressing these issues can be a barrier to successful implementations of IoT Systems in institutions, organizations, and cities. The Task Force will study this important space as well.

Early Task Force work will also include identifying and enumerating other independent and overlapping risk areas (operational, cyber, cultural, and others). Over the year, Task Force members will participate in phone conferences, listen to subject matter expert presentations, and identify, discuss, and prioritize IoT Systems issues. Finally, recommendations will be made for further focused work on the highest priority areas.  If you have questions, comments, further interest, please contact me ChuckBenson@longtailrisk.com or the Internet2 Chief Innovation Office at CINO@internet2.edu.


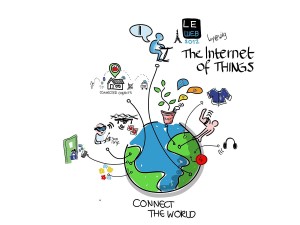
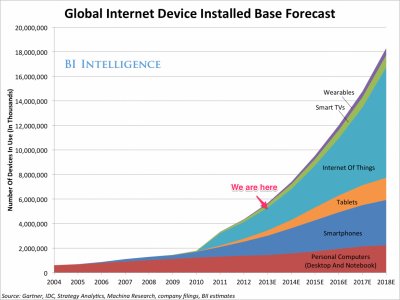
[IoT image above: By Wilgengebroed on Flickr – https://www.flickr.com/photos/wilgengebroed/8249565455/, CC BY 2.0, https://commons.wikimedia.org/w/index.php?curid=32745541]
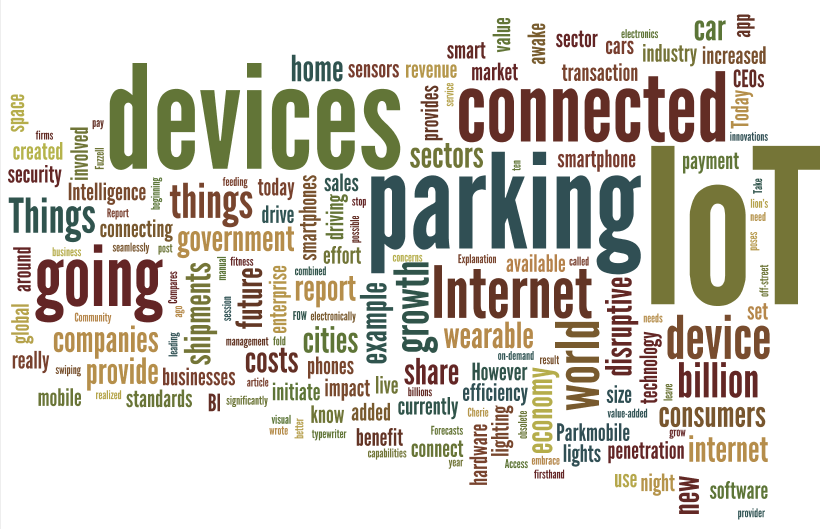
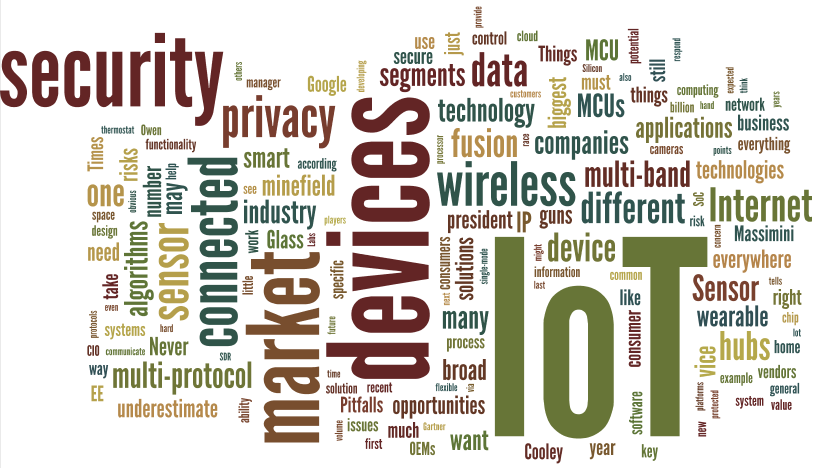
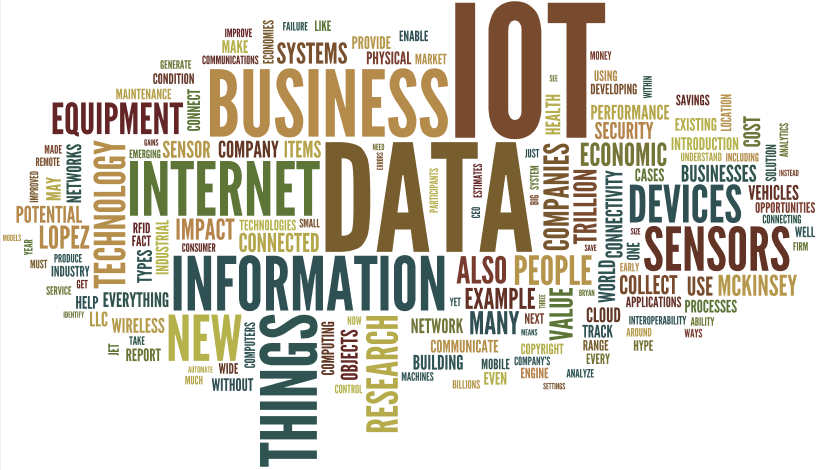
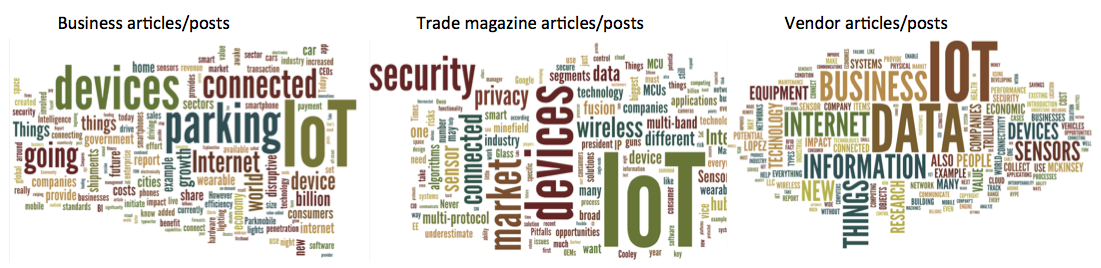
A potential IoT systems vendor checklist v2.0

In order to maximize the value of an IoT system to an institution or city, how that system is implemented is critical. Without a thoughtful and thorough implementation, the value of the investment will not be met and, possibly, the value can even be negative through the addition of unmitigated risk to the institution or city.

I’ve updated the IoT systems planning considerations list from an earlier post and created a more checklist-like document to use when working with IoT systems vendors. Earlier versions appeared in posts Institutional considerations for managing risk around IoT,  Developing an IoT vendor strategy, and Systems in the seam – shortcomings in IoT systems implementation. Ideally, this document could be used during the contract development and negotiation phases with the vendor.

The intent of the document is to help compute the Total Cost of Ownership for an IoT systems implementation as well as raise expectations of the vendor for a delivered system. In doing so, we can help mitigate some operational risk (suboptimal business decisions) as well as cybersecurity-related risk (bad guys wanting to use our assets in a malicious manner).

I’ve created rough categorizes of issues falling under operational risk, cybersecurity risk, and those falling in both categories to help provide some additional structure. However, many issues influence each other so it’s not critical to get tied up in the categorization.

IoTChecklistV2-032716

A starting point for an IoT systems vendor checklist

pdf version here

Looking for a quick definition of IoT?

Defining IoT (image Wikipedia)

Defining IoT
(image Wikipedia)


Tired of looking for the right words when trying to impress your boss, friends, or potential future spouse with a description of the Internet of Things, aka IoT ? Well look no further !

The 10 word version

Here’s a 10 word version. An IoT device is one that:

1. Computes
2. Is networked
3. Interacts with the environment in some way

The 20 word version

And once you’ve impressed them with this knowledge that just rolled off your tongue, feel free take it further with the 20 word version!

1. Computes
2. Is networked
3. Interacts with the environment with the intention of collecting sensory data and/or manipulating the local environment

For example:

  • A FitBit device computes, is networked, & interacts with the environment (ie you)
  • An industrial  SmartGrid meter computes, is networked, & interacts with the environment (collects power data)
  • A residential Nest meter computes, is networked, and interacts with the environment (collects temperature data)
  • Chicago’s Array of Things devices compute, are networked, and interact with the environment (collect many environmental data points)
  • Blood glucose monitors compute, are networked, and interact with the environment (ie you)
  • and much much more !!

And then, while impressing those around you, you can bring it on home with the definition of an IoT System. An IoT system:

1. Is a set of IoT devices that
2. Communicate with each other and/or communicate with
3. A central server that aggregates data and/or provides control data

Congratulations on your assured future personal, social, and professional successes now that a handy definition of IoT is at your disposal!

IoT & the Rule of 72

There are many different estimates regarding the growth rate of the Internet of Things (IoT). There are projections of number of connected devices, projections on market capitalization, projections on growth of semiconductor counts supporting those devices, and many others. Because the numbers of devices and systems are so high and these projections are around things that we typically don’t understand well, it’s hard to get a feel for what is actually increasing so rapidly. What is this thing that is growing so rapidly? How fast is it growing? If we can’t roughly understand the magnitudes involved, we can’t discuss, plan, assess, or begin to mitigate risk to our organizations and institutions involving these systems.

Going old school

summa

Summa de arithmetica – Wikipedia http://bit.ly/1MHOuxO

One way to better our ballpark understanding of this rate of growth can be with the old school method of applying the Rule of 72. Introduced by Pacioli in Summa de Arithmetica, the Rule of 72 has been around for over half of a millennium as a mental mechanism to quickly estimate how long it takes a value experiencing exponential growth to double. This works with systems that have parameters that are described by a percentage change over a period of time.  The classic example is interest on a loan or investment that compounds. Because we are used to seeing these kinds of measures in financial, economic,  and political systems, we will see them in IoT conversations also.

To apply the Rule of 72, you take the rate of growth for a period expressed as a percentage and then divide that into the number 72. The result is the number of time periods, typically expressed in years, that it takes for the doubling to occur.

For example, if you buy a house that increases in value by 6% per year, the time to double the value is:

72 / 6 = 12

or 12 years to double. So a $400,000 house purchased today that appreciates by 6% per year will see a value of around $800,000 in 12 years.

(72 is a convenient estimate that facilitates mental division with values such as 2, 3, 4, 6, 8, 12, etc. A more accurate, but less easy to mentally work with, value is closer to 69. This stems from the value for natural log 2, aka ln(2), which is .69314 … For our purposes, we’ll stick with 72.)

Making IoT growth estimates more understandable

As we all try to get our heads around IoT, what it is, and how fast it is growing, we are bombarded by a variety of estimates and figures. We know these numbers seem big, but we’re not really sure how to use these figures or compare them to something else. Being able to quickly compute how long it takes for something to double in quantity can have more meaning for us than trying to interpret growth expressed as a percentage.

In his book Grapes of Math, Alex Bellos does a great job of describing where the Rule of 72 comes from and how it works.  Further he reminds us that economic, financial, political, and other growth measures that describe sales, profits, stock prices, GDP, population, inflation, and more are often stated in percentage growth per year.  Because of our familiarity with communicating this way, we can expect at least some IoT growth projections to be stated this way as well.

Gartner Press Release http://www.gartner.com/newsroom/id/2905717

Gartner Press Release http://www.gartner.com/newsroom/id/2905717

Gartner’s installed IoT base estimate from late 2014 suggests exponential growth — 25% growth from 2013 to 2014, 30% growth from 2014 to 2015, and what looks like almost 40% annual growth from 2015 to 2020.  If this is the case, then we can estimate 72 / 40 = 1.8 years to double. So, if we started with the almost 5 billion devices indicated in the 2015 column, we’d have 10 billion in about 22 months, sometime in 2017 — 1.8 x 12 months.

GartnerPWCAnalysis

Analysis of IoT growth on semiconductor industry – http://pwc.to/1kwDuNc

This Gartner/PriceWaterhouseCoopers analysis shows a CAGR growth for sensors and actuators of approximately 10%.  Applying the Rule of 72 for an estimate, we can expect to see the number of sensors and actuators deployed in the world around us to double in ~72 / 10 = 7.2 years — less than 2 presidential terms. What will twice the number of sensors and actuators around us look like?

According to this IDC report, the IoT market will see 19% growth  for a market size doubling in a little under 4 years (72/19 = 3.8). The biggest growth area was 40% CAGR in the automotive sector for a market doubling in under 2 years.

BIIntelIotGrowth

Lots more connections … http://bit.ly/1msfrjG

This Business Insider report suggests a 45% year over year growth from 2 billion in 2014 to 9 billion in 2018 for connection count doubling in 72/45 = 1.6, a little over a year and a half.

And finally, ON World predicts a 250% growth in wireless light bulbs for a doubling in every ~ 3.5 months.

Limitations

It’s important to note that we don’t know what IoT growth will actually look like over several years. We have some initial data from the first few years that seem to suggest that this growth will be exponential versus linear growth, for example.  Also where the Rule of 72 was initially applied — money growth (compounding) —  is a recursive context — money grows because there is money to act on (and time). IoT growth will come from something else.  At least for now, it’s not obvious that IoT growth is or will be recursive* — we don’t know that many IoT deployments this year will cause even more deployments next year, and then that next year’s increased deployments will cause yet an even higher incremental increase the following year, and so on.

*[One frightening possibility, of course, is the Skynet scenario from Terminator where conscious machines build conscious machines and recursion in full play …]

If, however, IoT growth roughly mimics or correlates to compounding growth (for whatever reason), then we can use the Rule of 72 to help us quickly estimate magnitudes and time scales and add some context to our conversations. With more context around the phenomenon of IoT, the better are our chances for managing the risk to our organizations that comes from its proliferation.

Power laws & power plants – tackling IoT systems risk classification

Do aspects of Shodan data – data about Internet of Things (IoT) devices and systems – demonstrate ‘long tail’ qualities? Data showing these qualities sometimes also go by the name of having a ‘Zipf distribution‘, following a power law, or behaving according to the Pareto principle. If there is in fact a reoccurring relationship or curve that occurs across aspects of IoT data, that might offer some insights into how to categorize or classify aspects of IoT systems. For managing risk around IoT systems implementations, our current ability to classify and categorize these systems is sorely missing. Potentially, it could also offer predictive capabilities regarding elements of the Internet of Things phenomena.

To take an initial swing at it, I narrowed the question down to:

Do the frequencies of occurrences of particular ports (services) in an organization, or other Shodan data set, behave in a repeatable way?

Long tails & power laws

The concept of long tail behavior was popularized in Chris Anderson’s 2004 Wired article and it has entered popular vernacular in the years since. What Anderson articulated was that aspects of many systems or sets of data are characterized by the observation that there are a lot of a few types of things and then a rapidly dropping number of other types of things — but there are a lot of those other types. Anderson used the example of record sales — there are a relatively few mega-hit songs, but there are a lot of non-hit songs and record companies were learning how to capitalize on this observation. This is the long tail.

George Zipf

George Zipf

Another example is early ‘long tail’ work attributed to George Zipf with his analysis of word distribution frequencies in any particular text. He found that if you:

  1. counted how often each word appeared in a text
  2. ranked each word so that the word with the highest count got the highest rank (i.e. #1) and down from there
  3. plot the results in a graph

then you find a curve that shows that a few words show up a lot.


For example, the words ‘the’, ‘be’, and ‘to’ show up a lot (1st, 2nd, & 3rd in a ranked list) and words like ‘teeth’, ‘shell’, or ‘neck’ shows up around 1000 places down the list. From the first few spots in the ranked list, the frequencies of other ranked words fall off quickly — but there a lot of those ‘other’ words. Further, this curve is a power law which looks a bit like y = 1/x. Variations include multiplying 1/x by something and raising x to some exponent. (For Zipf relationships, this exponent is often close to 1).

Yet other Zipf relationships are found in studies of populations of cities data and website references.

citypopulationdata

Ranking city population sizes also follows Zipf-like relationships (the loglog plot is fairly linear)

Power law relationships in IoT data?

John Matherly, founder of Shodan, has been collecting data on IoT sorts of devices for years. He scans all publicly accessible IP addresses for particular ports for Internet of Things or Industrial Control systems including things like power plants, video cameras, HVAC systems, and others.

I have a particular interest in how IoT data shows in higher education IP address spaces, so I analyzed large subsets of data in some of those institutions. To do this I queried for data from those publicly facing IP spaces in the organization and exported it to a json format. (Shodan also offers an XML version, but it is deprecated). From the downloaded data, I used Python scripts to clean the data a bit, count how often each port occurred, and then rank them by organization. Finally, I used the Python module matplotlib to plot the results.

This is similar to the word frequency analysis approach above where, for a set of data:

  1. Count the number of occurrences of each port (service)
  2. Rank the ports so that the port (service) that occurs most frequently gets the highest rank
  3. Plot the results

Like word frequency data in Zipf studies, a plot of frequency of occurrence of each port vs rank of each port’s frequency yields a curve that drops off so fast that it is hard to discern nuanced information. However, the fact that it does drop off so fast let’s us know something at a glance that is similar to Zipf data — a very few ports occur most often and a lot of ports have a few occurrences.

nonlogmultipleuniversity

4 universities and 1 (organizationally) arbitrary & large) set of IP addresses on normal (non-log) plot

What gets more interesting visually is to plot that same data on a log log scale. This kind of brings the curve out to where it’s easier to see.

Zipf-like data can follow the relationship of y = 1/x almost exactly for much of the range. (This is part of why word frequency, city population data, etc is so intriguing.) So when plotted on log log, much of the line looks almost straight – slope of 1 (ish).

A log log plot of university IoT data doesn’t yield a straight line, but sort of a bulging out line. If you were standing on the graph way out to the right and up and looking toward the origin, it would appear convex. So this isn’t Zipf in the traditional sense — the log log plot is not linear.

However, they do look similar. University1 looks roughly like University2. University2 like University3, and University3 like University4, etc. The curve roughly retains its shape regardless of the school, though the school sizes are different (or at least the number of public IP addresses are different).

loglogmultipleuniversity

4 universities and 1 (organizationally) arbitrary & large set of IP addresses on log log plot

Maybe the organization doesn’t matter?

Also plotted are the results from a search on all of the IP addresses in the 128.0.0.0/8 range (using CIDR notation).  This curve, though bigger and slightly smoother, has roughly the same shape as the others. The main thing that separates it from the others appears to be magnitude (number of IP addresses sampled). It appears that there is nothing particularly unique about an organization that drives this curve shape — a similar shape appears even if a set based on a numerical range, regardless of organization, is chosen.

It will be interesting to see if, as IoT device count grows, the curve changes shape. Will the set of IoT devices across the globe continue to communicate mostly over the same ports/services as those currently in use, keeping the same shape? Or will new ports/services/enumerations show themselves as IoT device proliferation continues, changing the shape?  By analyzing ranking relationships over time and between organizations, this approach could provide some insight into helpful categorizations for risk analysis.

Institutional considerations for managing risk around IoT

socket

sockets for vendor products & services

There are a number of things to think about when planning and deploying an IoT system in your institution. In posts here since last spring, several issues have been touched upon — the idea of sockets and seams in vendor relationships, the rapid growth in vendor relationships to be managed and the resulting costs to your organization, communicating IoT risk, some quick risk visualization techniques based on Shodan data, initial categorization of IoT systems, and others.  The FBI warning on IoT last week is a further reminder of what we’re up against.

There is a lot to chew on and digest in this rapidly changing IoT ecosystem. Below is a partial list of some things to consider when planning and deploying IoT systems and devices in your institution. It’s not a checklist where all work is done when the checking is complete. Rather, it is intended to be a starting list of potential talking points that you can have with your team and your potential IoT vendors.

Some IoT Planning Considerations

  • Does IoT vendor need 1 (or more) data feeds/data sharing from your organization?
    • Are the data feeds well-defined?
    • Do they exist already?
    • If not, who will create & support them?
    • Are there privacy considerations?
  • How many endpoint devices will be installed?
    • Is there a patch plan?
    • Do you do the patching?
    • Who manages the plan, you or the vendor?
  • Does this vendor’s system have dependencies on other systems?
  • How many IoT systems are you already managing?
    • How many endpoints do you already have?
    • Are you anticipating/planning or planning more in the next 18 months?
  • Is there a commissioning plan? Or have IoT vendor deliverable expectations otherwise been stated (contract, memorandum of understanding, letter, other?)
    • Has the vendor changed default logins and passwords? Has the password schema been shared with you?
    • Are non-required ports closed on all your deployed IoT endpoints?
    • Has the vendor port scanned (or similar) all deployed IoT endpoints after installation?
    • Is there a plan (for you or vendor) to periodically spot check configuration of endpoint devices?
  • Has the installed system been documented?
    • Is there (at least) a simple architecture diagram?
      • Server configuration documented?
      • Endpoint IP addresses & ports indicated?
  • Who pays for the vendor’s system requirements (eg hardware, supporting software, networking, etc?)
    • Does local support (staffing/FTE) exist to support the installation? Is it available? Will it remain available?
    • If supporting IoT servers are hosted in a data center, who pays those costs?
      • startup & ongoing costs?
    • Same for cloud — if hosted in cloud, who pays those costs?
      • startup & ongoing costs?
  • What is total operational cost after installation?
    • licensing costs
    • support contract costs
    • hosting requirements costs
    • business resiliency requirements costs
      • eg redundancy, recovery, etc for OS, databases, apps
  • How can the vendor demonstrate contract performance?
    • Okay to ask vendor to help you figure this out
  • Who in your organization will manage the vendor contract for vendor performance?
    • Without person/team to do this, the contract won’t get managed
  • Can vendor maintenance contract offset local IT support shortages?
    • If not, then this might not be the deal you want
  • For remote support, how does vendor safeguard login & account information?
    • Do they have a company policy or Standard Operating Procedure that they can share with you?
  • Is a risk sharing agreement in place between you and the vendor?
    • Who is liable for what?

Typically, with the resources at hand, it will be difficult to get through all of these — maybe even some of these. The important thing, though, is to get through what we can and then be aware of and acknowledge the ones we weren’t able to do. It’s way better to know we’ve come up short given limited resources than to think we’ve covered everything when we’re not even in the ballpark.

Talking about IoT

word cloud from 3 business magazine articles on IoT

word cloud from 3 business magazine articles on IoT

I was curious if language in articles and blog posts on IoT varied significantly with the type of magazine or blog. So my unscientific quick and dirty research was to use three semi-arbitrarily* chosen articles from three different types of blog or magazine, do word frequency counts in each of these, and then from this do a word cloud where font size varies with frequency of the word count. The three magazine/blog types were: business magazine or blog, industry trade magazine or blog, and vendor magazine or blog.  (*I say ‘semi-arbitrarily’ because I chose them all myself and I’m sure my Googling/searching habits aren’t without some bias).

The first word cloud above was made by piling the words of all three articles together and then doing a word frequency count on the combined verbiage, sorting the counts, and then creating a word cloud. I used Wordle.net to do this and it makes the last three steps pretty easy to do.

Similarly, I made sorted word frequency word clouds for articles from three industry/trade magazines/blogs and did the same again for vendor magazines/blogs:

tradeiotwordcloud

word cloud from 3 industry/trade magazines/blogs

vendoriotwordcloud

word cloud from 3 vendor blogs

Side by side, they look like:

side by side comparison of the same

side by side comparison of the same (click to increase size)

While there are a number of things that could be done to make the comparison more robust (higher sample count, remove ‘stop words‘, etc), I think even this little snippet of samples shares some interesting results (or at least provides direction/motivation for digging deeper with a larger sample set). Some ‘eyeball’ observations from this sample set:

  • security & privacy more prevalent in trade/industry articles/posts
  • vendor articles/posts seem to hit harder on data
  • trades & vendors heavier on sensors
  • business sample skewed some with a chunk of text from one article dedicated to talking about IoT parking systems

Language use is important because, among other things, it directly affects how we categorize, classify, and discuss risk.

Again, no smoking gun here and there’s plenty of room to make this more robust, but the use of the language used to talk about IoT it becomes more prevalent might be interesting to keep an eye on.


**********
If you’re interested … the three articles/posts from business magazines/blogs were:
Wall Street Journal –
http://www.wsj.com/articles/the-internet-of-things-will-change-everything-1424664603
Forbes –
http://www.forbes.com/sites/jacobmorgan/2014/10/30/everything-you-need-to-know-about-the-internet-of-things/
Business Insider –
http://www.businessinsider.com/how-the-internet-of-things-market-will-grow-2014-10

The three articles/posts from industry/trade magazines and blogs were:
CIO magazine –
http://www.cio.com/article/2923475/innovation/cios-put-the-internet-of-things-in-perspective.html
Dark Reading –
http://www.darkreading.com/partner-perspectives/intel/securing-the-internet-of-things/a/d-id/1318072
EE Times
http://www.eetimes.com/document.asp?doc_id=1325079

And the three articles/posts from vendor articles/posts were:
Cisco –
http://www.cisco.com/web/solutions/trends/iot/introduction_to_IoT_november.pdf
Microsoft –
http://www.microsoft.com/en-us/server-cloud/internet-of-things.aspx
Atmel –
http://blog.atmel.com/2015/06/26/6-reasons-why-the-iots-true-value-remains-untapped/

Minuteness and power — learning to perceive IoT

physicsrockstars3.003

for those about to do physics, we salute you

Perceiving, working with, and managing risk around the Internet of Things (IoT) requires a new way of thinking. The vast and growing numbers of sensing-networked-computing devices, the great variability of types of those devices, the ambient-almost-invisible nature of many of the devices, and the emergent and unpredictable behavior from networked effects puts us into a whole new world. I don’t believe that, at present, we have the mindset or tools to even broadly perceive this cultural and technological change, much less manage risk around it.  In many ways, we don’t know where to start. The good news, though, is that there is historical precedent with changing how we perceive the world around us.

Physics rock stars of the 2nd millennium

While a lesser known name, one of the top 3 rock star physicists of the past half millennium or so is James Clerk Maxwell, sharing the stage with Isaac Newton and Albert Einstein. While known primarily for his contributions to electromagnetic theory, he made contributions in several other areas as well to include governorscolor photography, the kinetic theory of gases.  It was this latter work on the distribution of particle velocities in a gas that helped evolve the notion of entropy and led to bold new ways of perceiving the world around us. And he did all of this in his short 48 years of life.

In his book, Maxwell’s Demon: Why Warmth Disperses and Time Passes, author and physics professor Van Baeyer describes Maxwell as particularly adept at marrying theory with what was observable in the lab or elsewhere in the natural world. As Maxwell worked to come to terms with the work that Joule, Rumford, and Clausius had done toward the development of the 2nd law of thermodynamics, he realized that he was entering a world that he could no longer directly observe. This was a world of unseeable atoms and molecules that could not be counted and whose individual behavior could not be known. As Von Baeyer describes,

“What troubled him was the fact that molecules were too small to be seen, too numerous to be accounted for individually, and too quick to be captured … he no longer had the control that he had become accustomed to …”

In short, he had to abandon his expectations of certainty and find a new way to understand this realm.

To me, this has some similarities to what we’re dealing with with IoT:

  • molecules were many IoT devices are too small to be seen
  • [molecules were] IoT devices are too numerous to be accounted for individually
  • [molecules were] too quick to be captured individual IoT devices change state too often to track

The increasingly frequent lack of visibility of IoT devices, the large numbers of devices, the potentially nondeterministic behavior of individual devices, and network effects create the high probability of emergent and completely unpredictable effects and outcomes.

“… building up in secret the forms of visible things …”

In Maxwell’s own words, he says,

“I have been carried … into the sanctuary of minuteness and of power, where molecules obey the laws of their existence, clash together in fierce collision, or grapple in yet more fierce embrace, building up in secret the forms of visible things.”

Of this, in particular, I believe that the phrase,

“… molecules … clash together in fierce collision or grapple in yet more fierce embrace … building up in secret the forms of visible things …”

speaks to emergent, unpredictable, and possibly even unknowable things.  And I’m not at all saying this is all bad on its own but rather that we’ll have to look at it, perceive it, and attempt to manage it differently than we have in the past.

Minuteness and power

In none of this am I trying to suggest that the Internet of Things is exactly like gas molecules in a balloon or that all of the properties and formulas of molecules in a gas (or wherever) apply to all systems of IoT devices. However, the change in thinking and perception of the world around us that is required might be similar. The numbers and variability of IoT devices are huge and rapidly growing, the behavior of any particular device is uncertain and possibly not knowable, and network effects will contribute to that unpredictability of systems as a whole. I’m hoping that in the onrush of excitement about IoT, as well as the unseen subtlety and nuance of IoT, that we’ll acknowledge and respect the effects of that minuteness and power and work to adjust our perceptions and approaches to managing risk.

Who’s building your IoT data pipeline?

data pipelines require labor too

IoT data pipelines require labor too

There is a lot of excitement around IoT systems for companies, institutions, and governments that sense, aggregate, and publish useful, previously unknown information via dashboards, visualizations, and reporting.  In particular, there has been much focus on the IoT endpoints that sense energy and environmental quantities and qualities in a multitude of ways. Similarly, everybody and their brother has a dashboard to sell you. And while visualization tools are not yet as numerous, they too are growing in number and availability. What is easy to miss, though, in IoT sensor and reporting deployments is that pipeline of data collection, aggregation, processing, and reporting/visualization. How does the data get from all of those sensors and processes along the way so that it can be reported or visualized? This part can be more difficult than it initially appears.

Getting from the many Point A’s to Point B

While ‘big data’, analysis, and visualization have been around for a few years and continue to evolve, the new possibilities brought on by IoT sensing devices have been most recent news.  Getting an individual’s IoT data from the point of sensing to a dashboard or similar reporting tool is generally not an issue. This is because data is coming from only one (or a few) sensing points and will (in theory) only be used by that individual. However, for companies, institutions, and governments that seek to leverage IoT sensing and aggregating systems to bring about increased operating effectiveness and ultimately cost savings, this is not a trivial task. Reliably and continuously collecting data from hundreds, thousands, or more points, is not a slam dunk.

Companies and governments typically have pre-existing network and computing infrastructure systems. For these new IoT systems to work, the many sensing devices (IoT endpoints) need to be installed by competent and trusted professionals. Further, that data needs to be collected and aggregated by a system or device that knows how to talk to the endpoints. After that (possibly before), the data needs to be processed to handle sensing anomalies across the array of sensors and from there, the creation of operational/system health data and indicators is highly desirable so that the new IoT system can be monitored and maintained. Finally, data analysis and massaging is completed so that the data can be published in a dashboard, report, or visualization. The question is, who does this work? Who connects these dots and maintains that connection?

who supplies the labor to build the pipeline?

who supplies the labor to build the pipeline?

The supplier of the IoT endpoint devices won’t be the ones to build this data pipeline. Similarly, the provider for the visualization/reporting technology won’t build the pipeline. It probably will default to the company or government that is purchasing the new IoT technology to build and maintain that data pipeline. In turn, to meet the additional demand on effort, this means that the labor will need to be contracted out or diverted from internal resources, both of which incur costs, whether direct cost or in opportunity cost.

Patching IoT endpoint devices – Surprise! it probably won’t get done

Additional effects of implementing large numbers of IoT devices and maintaining the health of the same include:

  1. the requirement to patch the devices, or
  2. accept the risk of unpatched devices, or
  3. some hybrid of the two.

Unless the IoT endpoint vendor supplies the ability to automatically patch endpoint devices in a way that works on your network, those devices probably won’t get patched.  From a risk management point of view, probably the best approach is to identify the highest risk endpoint devices and try to keep those patched. But I suspect even that will be difficult to accomplish.

Also, as endpoint devices become increasingly complicated and have richer feature sets to remain competitive, they have increased ability to do more damage to your network and assets or those of others on the Internet. Any one of the above options increase cost to the organization and yet that cost typically goes unseen.

Labor leaks

Anticipating labor requirements along the IoT data pipeline is critical for IoT system success. However, this part is often not seen and leaks away. We tend to get caught up in the IoT devices at the beginning of the data pipeline and the fancy dashboards at the end and forget about the hard work of building a quality pipeline in the middle. In our defense, this is where the bulk of the marketing and sales efforts are — at each end of the pipeline. This effort of building a reliable, secure, and continuous data pipeline is a part of the socket concept that I mentioned in an earlier post, Systems in the Seam – Shortcomings in IoT systems implementation.

With rapidly evolving new sensing technologies and new ways to integrate and represent data, we are in an exciting time and have the potential to be more productive, profitable, safe, and efficient. However, it’s not all magical — the need for labor has not gone away. The requirement to connect the dots, the devices and points along the pipeline, is still there. If we don’t capture this component, our ROI from IoT systems investments will never be what we hoped it would be.


Creating initial IoT risk categories

With the onslaught of new IoT systems and devices as well as existing old school IoT-ish systems such as HVAC, we all know that this is risk that needs to be assessed and managed. However, some of it is so new that we don’t really know where to start. We don’t have a broadly understood language to discuss, categorize, and classify new IoT systems. There has to be at least some rough categorization if there is going to be any attempt to manage risk brought to our organizations by evolving and rapidly growing numbers of IoT systems and devices.

Whence it came — using provenance to create IoT risk buckets

One approach to an initial categorization to IoT systems and devices can be to identify where those IoT systems are coming from. How do they show up in your offices, buildings, and corporate/institutional spaces? How did they get there?

Some IoT just 'walks on' to corporate and institutional spaces while other IoT systems are purchased via different mechanisms

Some IoT just ‘walks on’ to corporate and institutional spaces while other IoT systems are purchased via different mechanisms

While trying to categorize IoT systems and devices by function, features, behavior, etc is a logical approach, it can be difficult to do in practice because so many new and varied IoT systems, devices, and applications are constantly showing up on our networks. Categorization and classification with this more traditional method can be a moving target, at least for now. Also, this approach can lead us down a rabbit hole looking for a perfect (and complex) taxonomy that would take a long time to develop, would likely be poorly understood, and probably largely not agreed upon. It reminds me of some older large websites that might have had perfect, library-like taxonomies but where 90% of the pages were never accessed.  The website’s taxonomy might have been awesome, but no one cared.  In fact, that perfect taxonomy might have actually diminished usability.

To begin the process of managing IoT risk now, we need some categorization now so that we have some buckets of risk to work with. This doesn’t mean that efforts to develop other classification schemes should be abandoned, but rather that categorizing IoT risk by source, aka the-way-it-got-here, is an approach that we can work with now.

Size matters

The manner in which businesses or institutions purchase IoT devices and systems typically varies with size of the organization. Smaller organizations will likely have fewer purchasing mechanisms than larger organizations. For example a small company might write a check or use a company credit card to purchase a simple IoT-based security system. Where as a larger organization might have a person or purchasing department that handles many purchases, uses purchase orders and invoicing, and probably has some purchasing policies and criteria and is used to purchase an HVAC system, for example.  And yet an even bigger organization or government might have a central planning office that makes recommendations for new buildings or large scale building or community asset modifications. Larger organizations probably have all of these.

Regardless of how many purchasing options an organization has, using purchasing options to create categorized buckets of risk for IoT devices and systems could be a helpful way to go.

Walk-On-IoT — bring it, wear it, or fly it to work

One thing that all organizations have in common is that they all have “walk-on-IoT”. By the walk-on-IoT category, I mean IoT systems purchased or acquired by an individual on their own and that they then bring to work. Whether it is FitBit devices, drones, robotics, consumer networked video cameras, or others, these are devices that a person can purchase at BestBuy, Target, Amazon, or even their local drugstore and bring directly to their corporate or institutional work place.

Other potential source-based IoT risk categories

Some other potential source-based IoT risk categorizations might be:

  • IoT devices/systems purchased with a company credit card
  • IoT devices/systems purchased via a company’s central purchasing/contracting group
  • IoT devices/systems recommended in the course of planning for major building modifications or new buildings (eg, in the case of large businesses and cities)
Identifying where an IoT system or device came from as a basis for initial IoT risk categorization

Identifying where an IoT system or device came from as a basis for initial IoT risk categorization

With these categories, we can start to ask some high level risk questions within each category. For example, is it even possible to feasibly manage this risk? If this risk is unmitigated, what is the impact? For example, can I really manage FitBit devices that walk on to my network? Probably not easily. More importantly, do I really care if FitBit users use their devices on my networks?  Maybe not.

Conversely, because of privacy issues and other concerns, I might indeed care about how an enterprise-wide biometric building access system is selected, installed, commissioned, and supported over its lifetime. Furthermore, this risk probably is manageable with thoughtful institutional safeguards.

Source-based categories can lend themselves to unique risk mitigation approaches

Finally, sourced-based IoT risk categorization can also provide some natural mitigation approaches. For example, purchases via central purchasing can provide the opportunity to see a purchase request (prior to actual purchase) and then provide guidance on the selection of the IoT system, help identify resources for secure implementation, as well as help develop long term support plans for the IoT system. While less involved, IoT purchases via corporate credit card have records amenable for review so that an organization can get an estimation of number and variety of types of IoT devices and systems arriving in the enterprise. This can help with ongoing mitigation and support services planning.

Source-based categories for IoT system risk analysis and management for the enterprise can be a place to start. It is not the end-all by any stretch. As more IoT systems and devices enter our enterprises, we will learn more about their short and long term effects as well as emergent effects between IoT systems. From this we can continue to evolve categories and approaches, but if we need a place to start now, source-based risk categories are not a bad idea.