
Determining the total cost of ownership, operation, and stewardship of IoT Systems for an institution or city has a number of considerations. Some of these considerations are shared with traditional enterprise systems and some are unique to IoT Systems. Lack of realization and acknowledgement of these costs can lead to disappointing and costly IoT Systems outcomes. These disappointing outcomes manifest themselves in the lost ROI of an IoT investment as well as negative impacts to the cyber-risk profile to an institution.
Listing from least complex/nuanced to more complex/nuanced …
- Costs to host servers, databases, & redundancy — whether under desks (hopefully not), in local data centers, or in the cloud
- Costs to support large numbers of geographically distributed ‘Things’ & devices (the T in IoT) & the different institutional organizations that may be involved (some of which may not see or realize the potential benefit to the institution but may bear at least some of its support costs)
- Costs stemming from the natural friction, sometimes small & sometimes large, between multiple historically disparate organizations within an institution as they attempt to coordinate, collaborate, and address problems of understanding to support the system
1. The more familiar part — application server, database server, & redundancy costing
This costing is more closely aligned with traditional enterprise application costing than other IoT systems costs. Application licensing and support agreements are a part of this aspect. Important additional costs to include, though, are: what are the costs of hosting those applications and databases? And what are the costs of supporting that hosting (e.g. who manages the relationships, the tickets, the problems, etc).
The applications servers or virtual machines (VM’s), database servers/VM’s, and redundancy servers/VM’s can be hosted in a local data center, shared data center, the cloud, or similar. Hosting or otherwise servicing these applications and supporting databases have their own costs. In addition to fees for the hosting, there’s also some cost to managing the vendor relationship and agreement/contract.
2. A guy, a truck, and a ladder – a less obvious part of IoT System costing
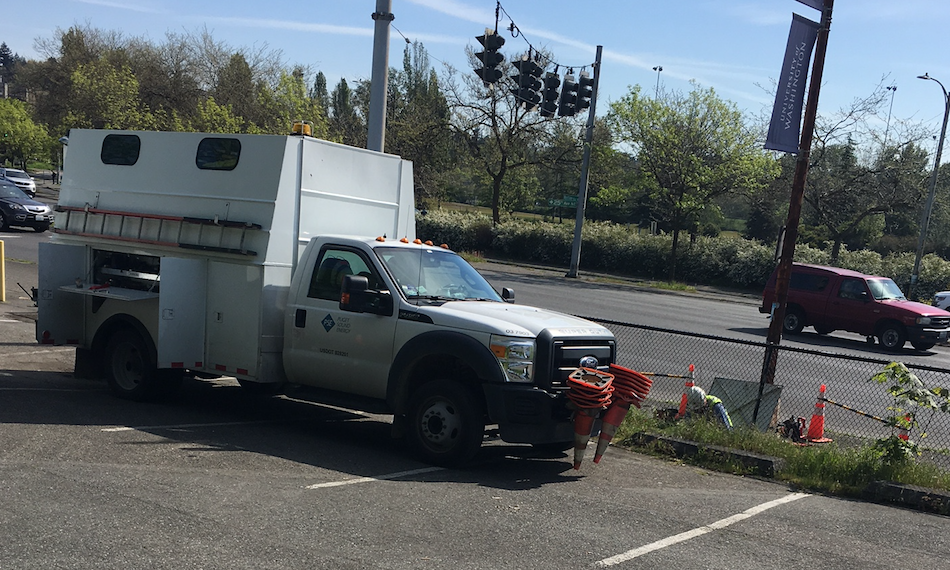
this is not cheap
Imagine an institution or city that implements 500 smart street lights that provide lighting, sense movement, maybe samples air quality, and possibly monitors and reports street or underground vibration. There will be some failure rate amongst the components in any single device/endpoint and some failure rate across the total number of installed devices/sensors – the T’s in IoT.
In this hypothetical scenario, troubleshooting and/or repair means:
- deploying 1 or more skilled tradespeople
- 1 or more for the work & possibly another as a safety observer
- rolling a truck or trucks
- with associated vehicle/fleet/fuel costs
- spending 1-2 hours just to get to the point of troubleshooting/repair
- 2 – 4 hours troubleshooting/repair
- 1-2 hours wrap up and return
For this hypothetical example, let’s say the skilled tradespeople involved make $60/hour and their benefit load (expense to institution or city) is 25% for a total $75/hour expense. So, disregarding fleet and related costs, one estimate might be:
(2 hrs prep + 4 hrs on site troubleshooting/repair + 2 hrs recovery) x 2 tradespeople x $75/hr = $1200 per support event
Continuing on the thread, let’s say there’s a 10% / year failure rate (or required hardware/software update rate) of at least some component on a single device or Thing (T in IoT). That would be:
500 devices x 10% repair or troubleshoot rate/year x $1200/event = $60,000 / year
That dollar figure starts to become non-trivial. And that’s just one IoT System. Cities and institutions will have many, a portfolio, of well-managed or less-well-managed IoT Systems. Another hypothetical example is in the example below —
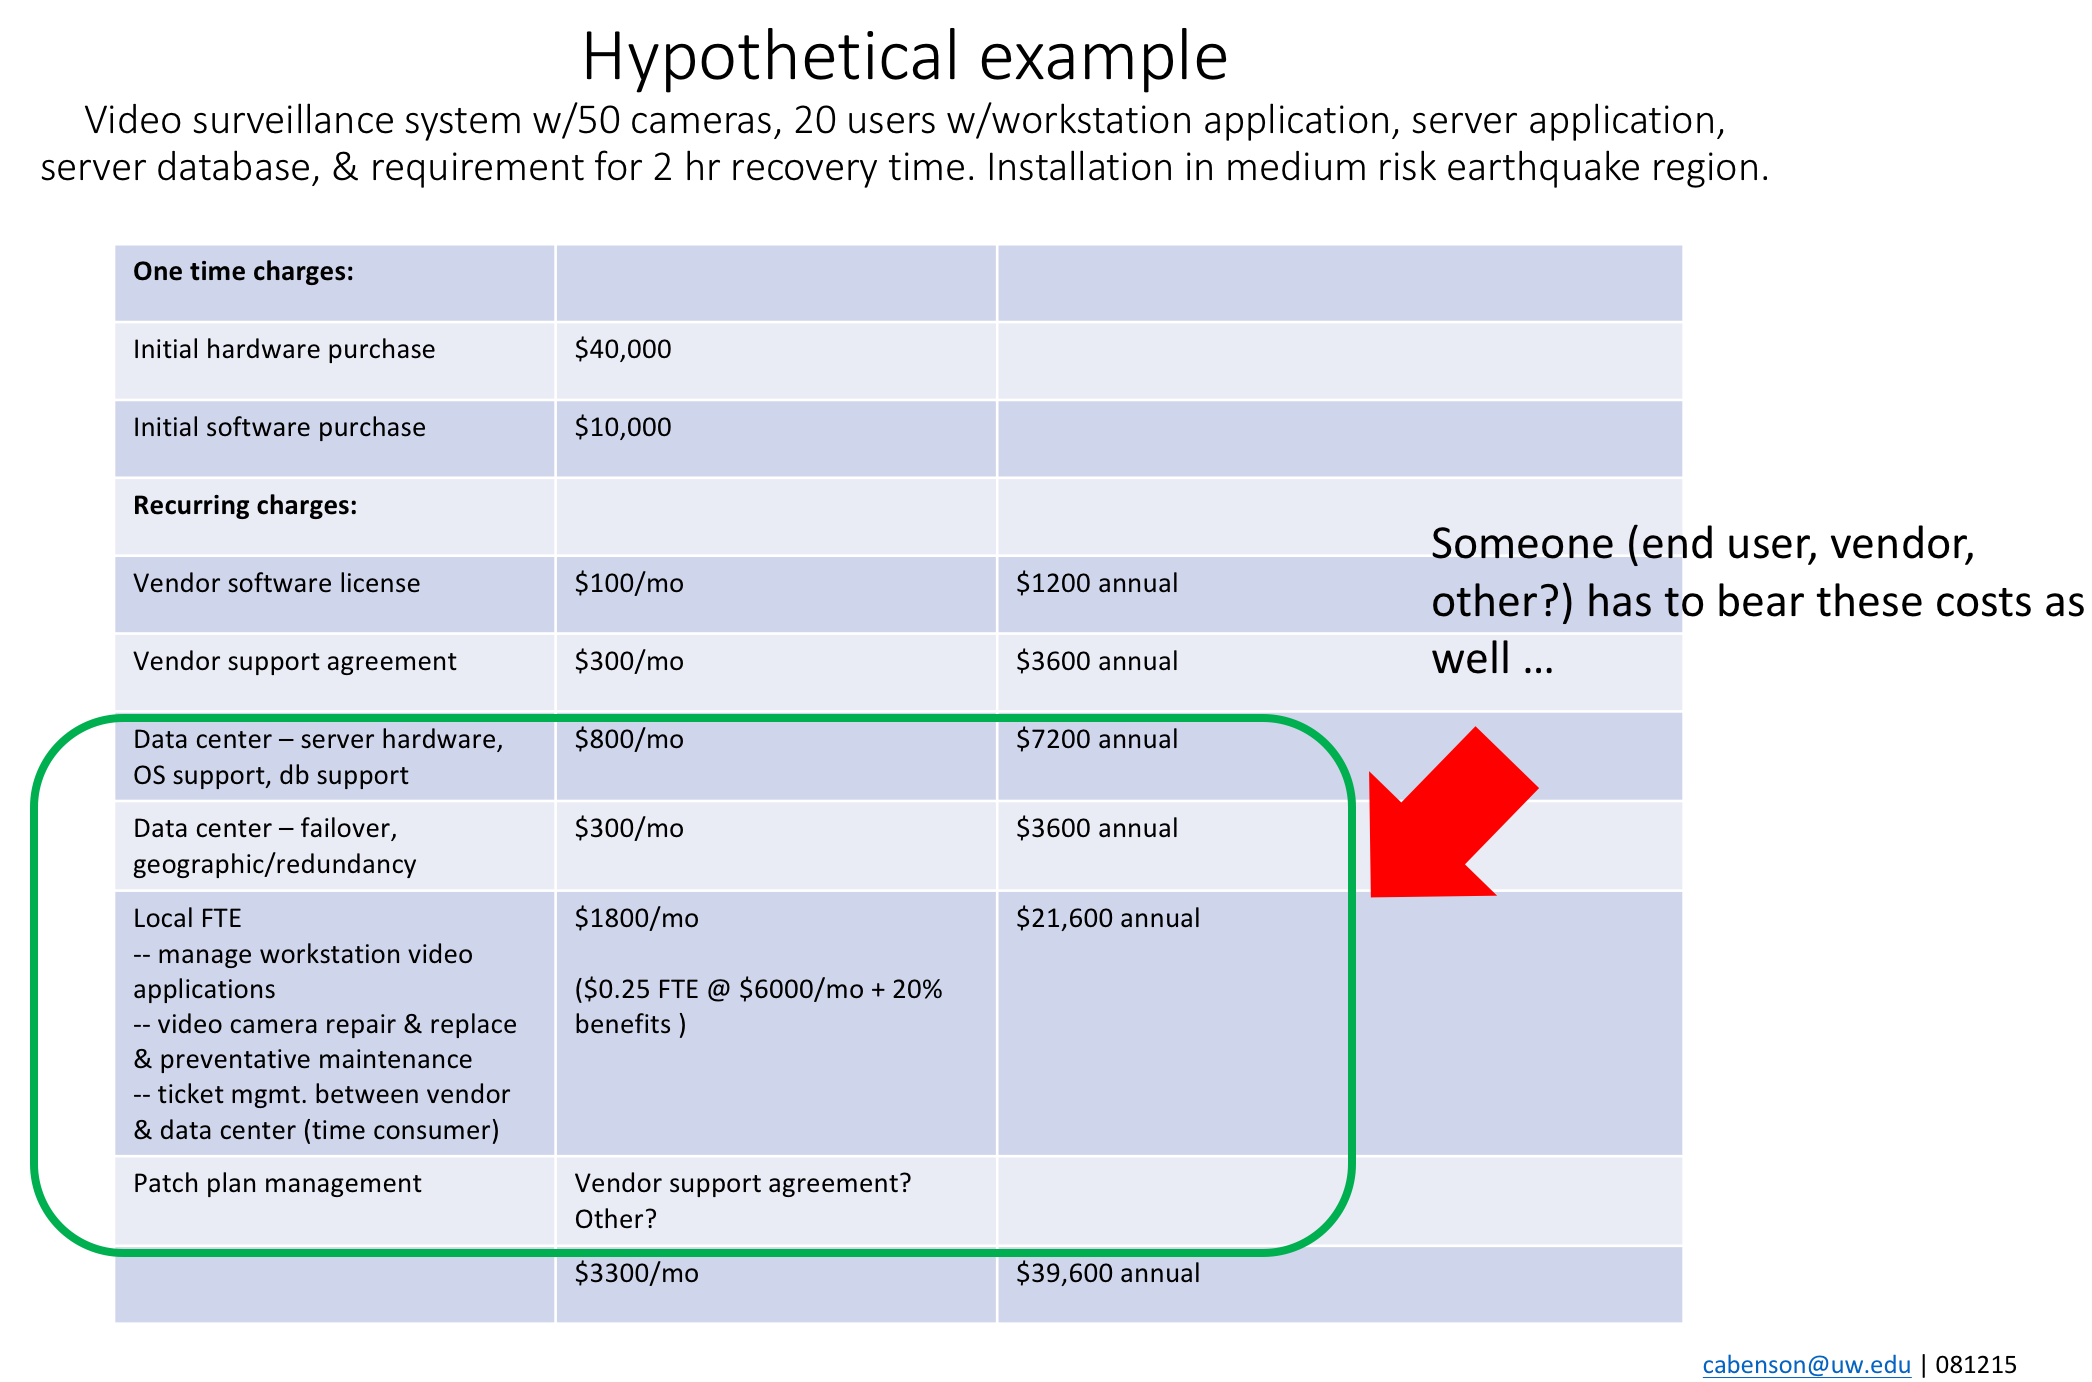
multiple costs involved
3. The insidious part — loss from organizational friction
The least apparent and possibly most costly aspect is the loss that occurs from the coordination and collaboration required between organizations and the oversight needed across all of them for a successful implementation. In the idealized scenario of institutional capacity, there is a homogeneous set of resources that include components such as available staffing levels (FTE), requisite skill sets (technical, operational, and interpersonal), support funding, political/institutional will to support the implementation and operation of the IoT System, vendor relationships, and other.
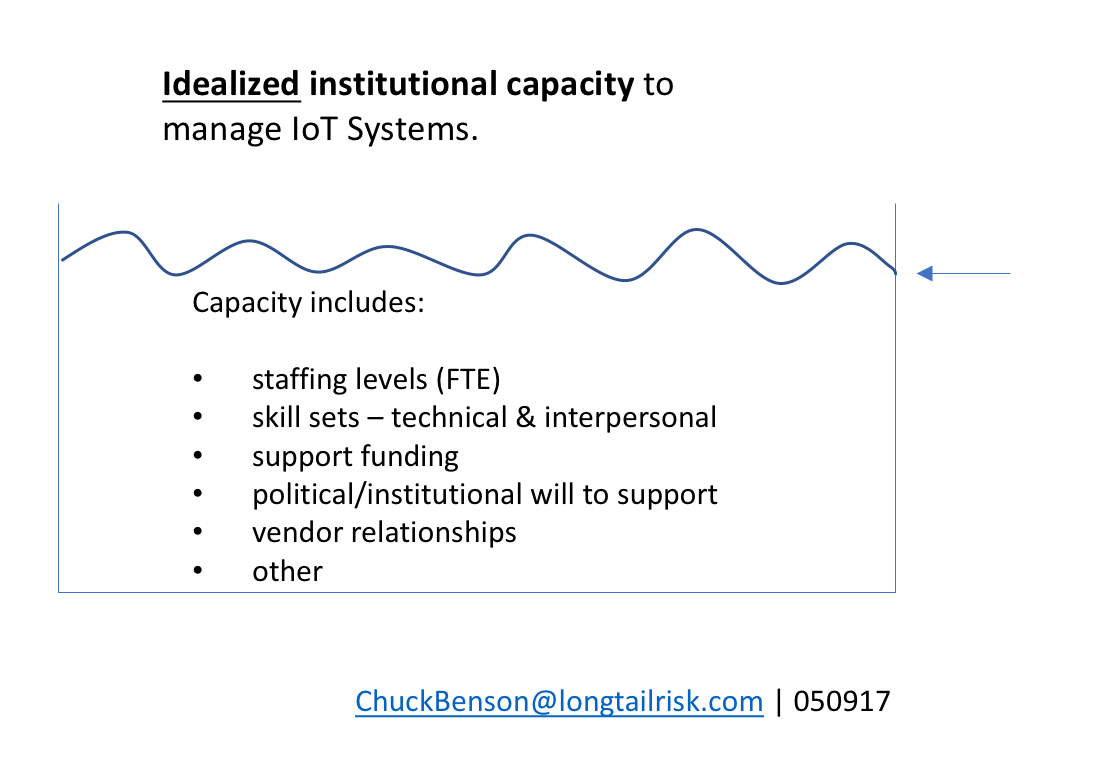
idealized view of IoT System management capacity
In practice, however, this institutional capacity is comprised of many different organizations and the interrelationships between them. While collaboration and inter-organizational cooperation is typically universally lauded, we all know from personal and professional experience that often collaboration between institutional organizations does not in fact work so well. Research has also been done on this phenomena where, “the discrepancy between the promise of collaboration and the reality of persistent failure” is studied (Koschmann).
Wherever two or more organizations interact with each other, some sort of friction or system loss is present. Metaphorically similar to the 2nd law of thermodynamics, not all of the time, energy, resources put into ostensible institutional IoT System management capacity will be used, or can be used, to do the expected work. In the organizational friction example, losses can come from a multitude of sources where the number of friction sources and the intensity of each can vary from organizational relationship to organizational relationship. Examples of this sort of friction/system loss and resultant loss in expected institutional capacity include:
- limited administrative resources (planning, meetings, time, support, etc)
- lack of precedence for coordination/collaboration for IoT Systems, i.e. no patterns to follow
- misunderstanding / problems of understanding between organizations
- misalignment of objectives between organizations
- conflicting obligations to different scopes, projects, and organizations
- lack of shared objectives
- different expectations of effort
- different expectations of data
- cultural differences
- political objectives supporting different time frames
- other
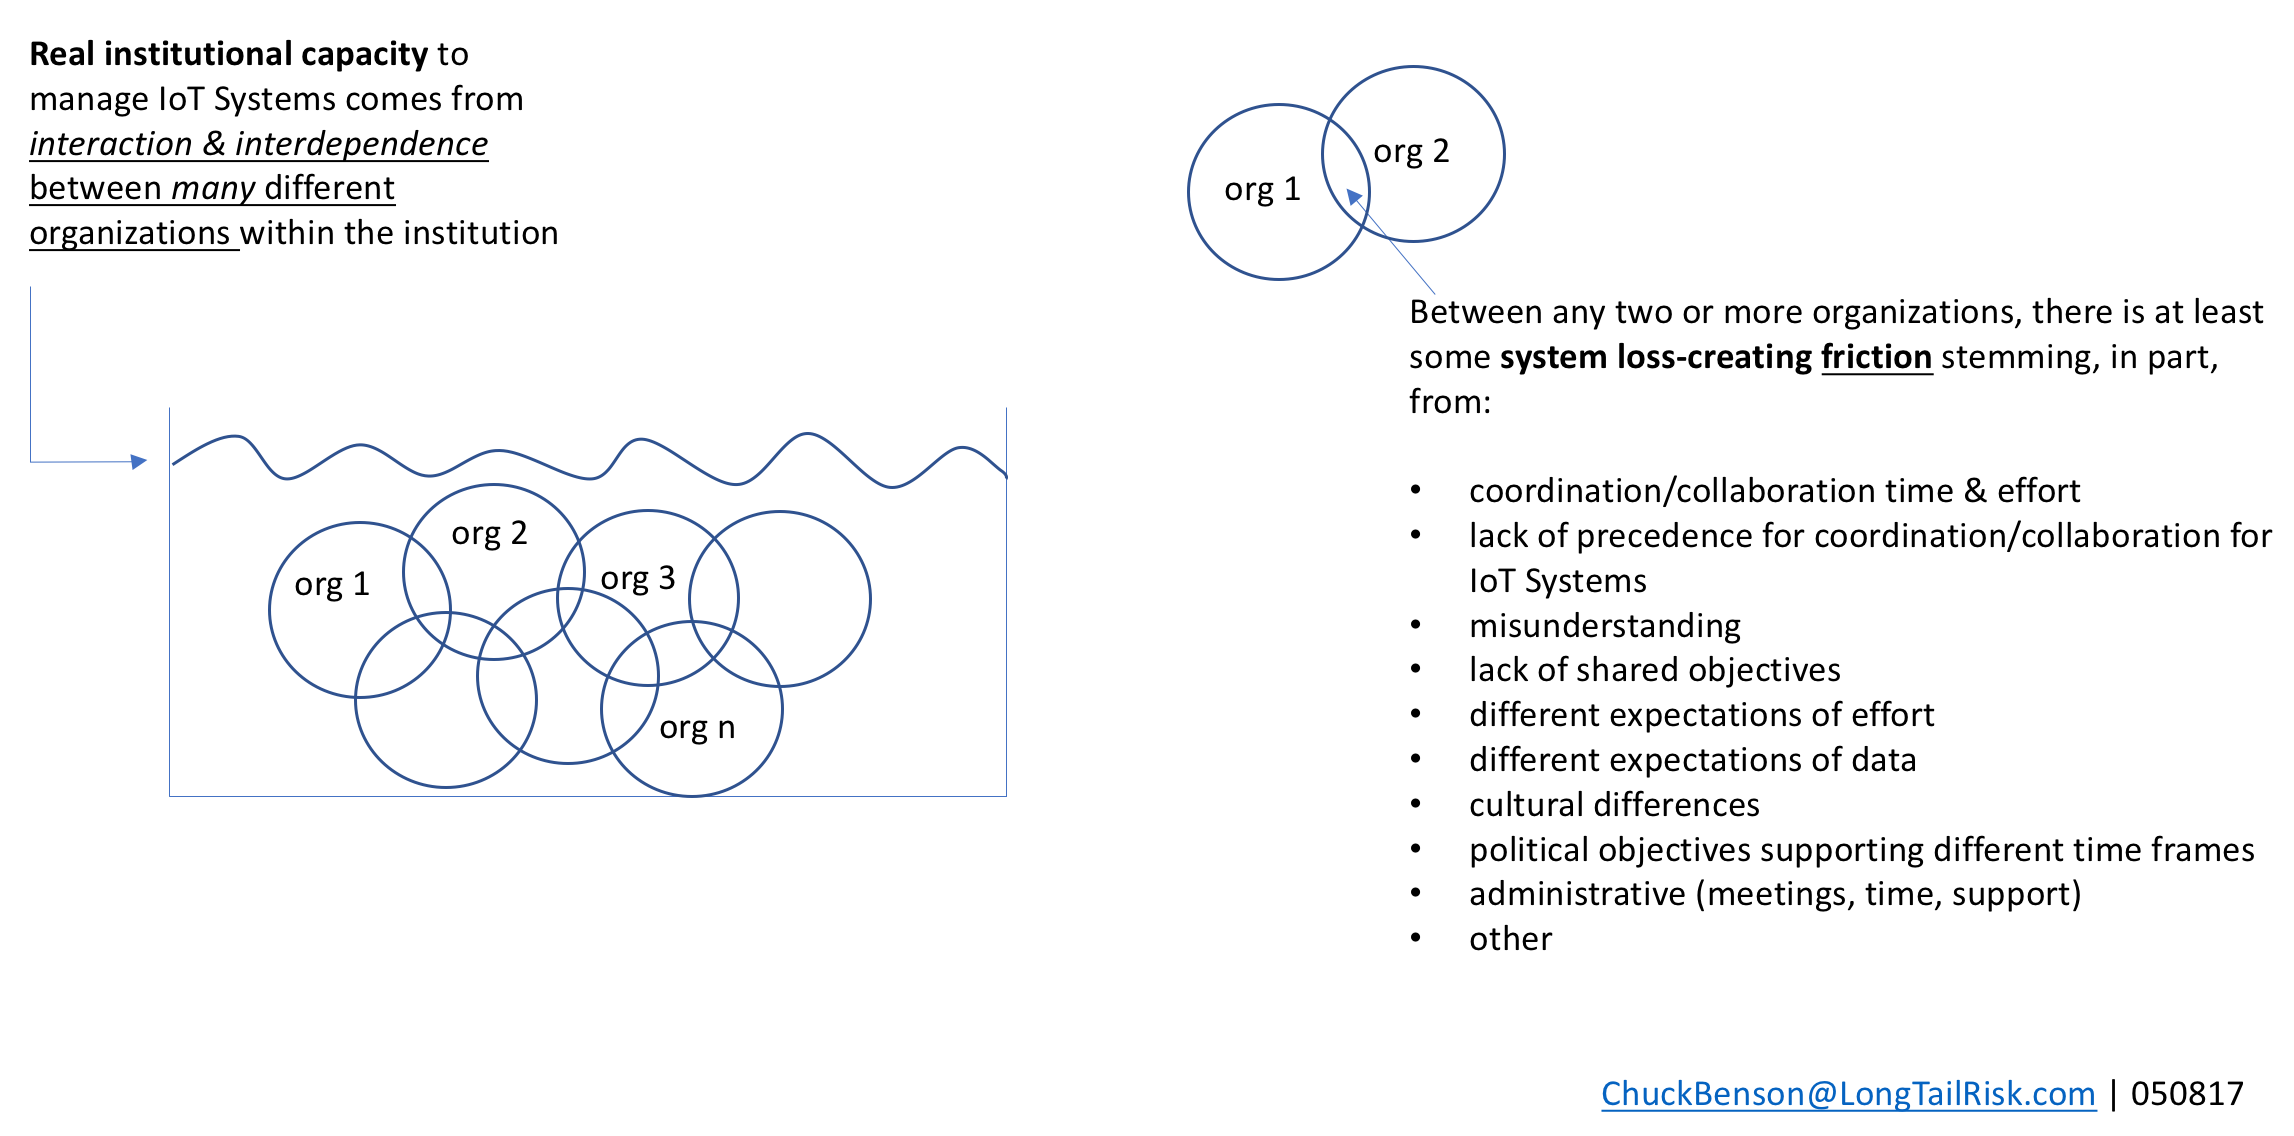
real capacity stems from multiple organizations with multiple relationships and the friction between
The insidious part is that while the friction between any two organizations, may be small and possibly not obvious, these small instances of organizational friction aggregate across the whole institutional and IoT System implementation effort. Further, not all relationships are one-to-one. There are often many relationships where many organizations are involved. Likening to Newton’s Three Body Problem, adding a third planet, billiard ball, or organization can significantly increase the complexity of analysis, prediction/forecasting, and the ability to get work done.

Costing differently
In practice, capturing all of these costs can be challenging. #1 — application and database licensing and hosting costs is relatively the most straightforward and for which we generally have the most experience, but that doesn’t mean it’s effortless. We have less experience with #2 for IoT Systems — the guy, truck, & ladder costs — but that support cost can be estimated and the failure rates of devices and device components can be estimated. Costing #3 — aggregated inter-organizational friction is, by far, the most difficult and possibly the most impactful — in part because of its magnitude and in part because of the uncertainty it introduces.
The import thing, I believe, is to acknowledge all of these components, compute and estimate what we can, and work to allow for and hopefully prepare for the unique uncertainty that selecting, procuring, implementing, and managing IoT Systems brings. If we do this work, we have our best chance of reaching anticipated ROI and not degrading (possibly even enhancing) the risk profiles of our cities and institutions.